Download
1 / 21
210 likes | 312 Views
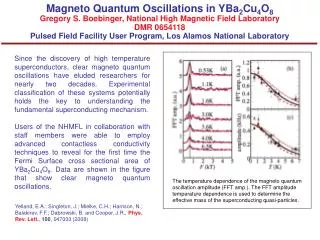
Temperature dependence of locked mode in a Single-Electron Latch. Alexei O. Orlov Department of Electrical Engineering University of Notre Dame, IN, USA. Notre Dame research team. Experiment: Dr. Ravi Kummamuru Prof. Greg Snider Prof. Gary Bernstein Theory Mo Liu Prof. Craig Lent

E N D
Temperature dependence of locked mode in a Single-Electron Latch Alexei O. Orlov Department of Electrical Engineering University of Notre Dame, IN, USA
Notre Dame research team • Experiment: • Dr. Ravi Kummamuru • Prof. Greg Snider • Prof. Gary Bernstein • Theory • Mo Liu • Prof. Craig Lent • Supported by DARPA, NSF, ONR, and W. Keck Foundation
Outline of presentation • Introduction • Power Gain in nanodevices • Clocked single-electron devices • Bistability for memory • Experiment and simulations • Temperature dependence of bistability and hysteresis loop size • Summary and conclusions
Current becomes small - resistance becomes high Hard to turn next switch Charge becomes quantized Power dissipation threatens to melt the chip! Valve shrinks also – hard to get good on/off New idea Solid-state transistors Electromechanical relay Vacuum tubes CMOS IC Quantum Dots Problems shrinking the current-switch
energy x How to make a power amplifier using quantum wells? Keyes and Landauer, IBM Journal of Res. Dev. 14, 152, 1970 1 0 Clock 0 Clock Applied Input Removed Small Input Applied 0 but Information is preserved!
A cell with 4 dots 2 extra electrons Charge configuration Polarization P = -1 Bit value “0” Quantum-dot Cellular Automata Old Paradigm New Paradigm Current switch Tunneling between dots Polarization P = +1 Bit value “1” Neighboring cells tend to align. Coulomb coupling
P= +1 P= –1 Null State Clocking for single-electron logic:Quantum-dot Cellular Automata and Parametrons Semiconductor dots (QCA): Clocking achieved by modulating barriers between dots Metallic or molecular dots (parametron): Clocking achieved by modulating energy of third state directly • Clocked QCA : Lent et al., Physics and Computation Conference, Nov. 1994 • Parametron: Likharev and Korotkov, Science 273, 763, 1996
Resulting Pattern Oxidation Metal “dot” fabrication process • Aluminum Tunnel junction technology combining E beam lithography with a suspended mask technique and double angle evaporation • Oxide layer between two layers of Aluminum forms tunnel junctions. 2nd evaporation 1st evaporation NanoDevices Group
Ultra-sensitive electrometers for QCA • Sub-electron charge detection is needed • Single-electron transistors are the best choice SET electrometers can detect «1% of elementary charge.
A +VIN +VIN Vg D1 ~ +VIN +VIN MTJ MTJ D2 +VIN +VIN D3 Single-Electron Latch: a Building Block Layout And Measurement Setup The third, middle dot acts as an adjustable barrier for tunneling Electrometer 1mm MTJ=multiple tunnel junction SEM Micrograph of SE latch
-VIN=0 -VIN +VIN=0 +VIN Animated three-dot SE latch operation (0,-1,1) storage of “1” (0,0,0) (0,-1,1) back to neutral (0,0,0) (0,-1,1) switch to “1” (0,0,0) neutral • Clock signal >> Input signal • Clock supplies energy, input defines direction of switching • Three states of SE latch: “0” , “1” and “neutral” Bit can be detected D2 D1 D3 + -VCLK VCLK=0
Weak input signal sets the direction of switching Clock drives the switching Bistable Switch + Inverter demonstrated Memory Function demonstrated Latch +VIN D3 VCLK D2 -VIN “High” D1 E1 SET electrometer Experiment: Single-Electron Latch in Action T=100 mK Input Clock Switch to “0” Hold “1” Switch to “neutral” Switch to “neutral” Hold “0” Switch to “1”
region suitable for latch operation Binary “1” Binary “0” How temperature affects bistability? • 2 level switch with memory = there must be a Hysteresis • SEL operates fine @ T=100 mK • Charging energy consideration EC≥10 kT , EC =0.8 meV (9.3 K) • What is the highest operating temperature? • Zero K calculations were performed before • Korotkov et al. (1998) • Toth et al. (1999)
EC EC EC EC EC EC EC EC EC EC EC EC EC EC 0 0 0 EC EC EC EC EC -e2/Cin -e2/Cin -edV -edV -edV -edV -edV -edV +e2/Cin +e2/Cin +edV +edV +edV +edV +edV +edV +0 -0 0 0 0 0 0 0 0 0 0 Sweeping input bias Assume Coulomb barrier is the same for hops between adjacent dots Equilibrium Border VD1(mV) D1 VIN- VIN+ VCLK=0 2.5 5 0 VIN(mV)
kT EC EC kT kT e×(-dV) e×(+dV) 0 How bistabile behavior scales with temperature? • Thermal energy surmounts Coulomb barrier • Hysteresis loop shrinks and then disappears
Hysteresis loop change with Temperature T=320 mK T=160 mK Calculations performed using time dependent master equation for orthodox theory of Coulomb blockade T=90 mK
DV V0 Bistability area vs kT • Relative loop size DV/V0 • Calculations represent ensemble averaging = averaging over multiple scans • At T >300 mK no bistability is observed • Bistability disappears for kT~W/30, where W is Coulomb barrier • At T=>0 (DV/V0 )>1, it means that system becomes multistable
Vc Summary & Conclusions • Temperature dependence of bistable switching in Single-Electron Latch is studied experimentally • Theoretical calculations using time-dependent master equation are performed • Hysteresis loop size vs temperature is studied • Bistability disappears as kT reaches EC/30 • For 300K operation W~30 kT≈1 eV • The real world applications can be implemented using “molecular assembly line” once technology becomes available Molecular Single-Electron Latch Metal-dot Single-Electron Latch
Measured and calculated charging diagrams • Charging diagram is a 3D plot (gray scale map) of dot potential vs input and clock bias • White is positive, black is negative • Calculated data are superimposed with measured
Single-Electron Latch in Action • Two electrometers are used • Both are connected to end dots