Download
1 / 15

E N D
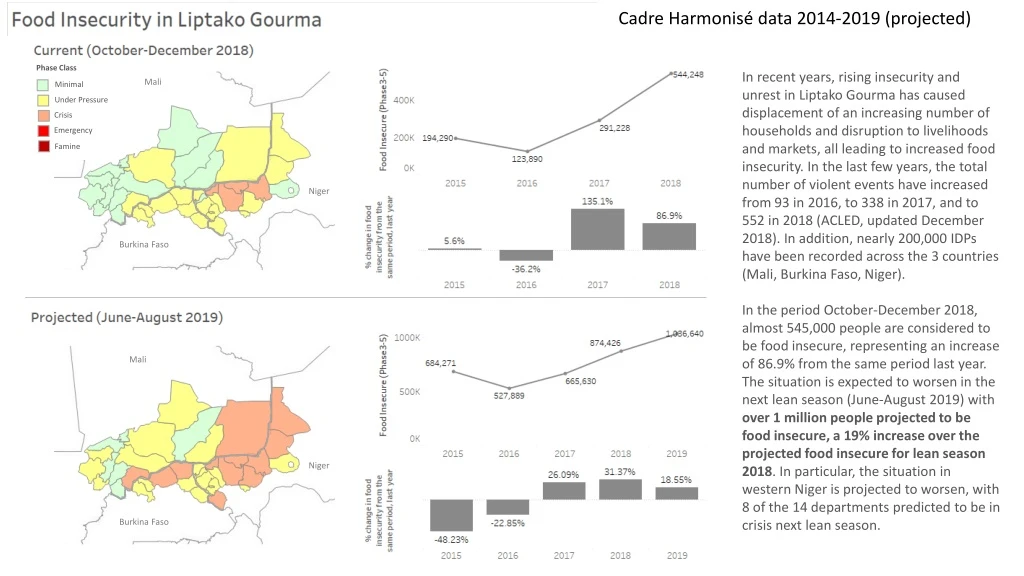
Cadre Harmonisé data 2014-2019 (projected) In recent years, rising insecurity and unrest in LiptakoGourma has caused displacement of an increasing number of households and disruption to livelihoods and markets, all leading to increased food insecurity. In the last few years, the total number of violent events have increased from 93 in 2016, to 338 in 2017, and to 552 in 2018 (ACLED, updated December 2018). In addition, nearly 200,000 IDPs have been recorded across the 3 countries (Mali, Burkina Faso, Niger). In the period October-December 2018, almost 545,000 people are considered to be food insecure, representing an increase of 86.9% from the same period last year. The situation is expected to worsen in the next lean season (June-August 2019) with over 1 million people projected to be food insecure, a 19% increase over the projected food insecure for lean season 2018. In particular, the situation in western Niger is projected to worsen, with 8 of the 14 departments predicted to be in crisis next lean season. Phase Class Mali Minimal Under Pressure Crisis Emergency Famine Niger Burkina Faso Mali Niger Burkina Faso
Number of food insecure and percent variation compared to the previous lean season for the region as well as by country Sharp increase in food insecurity in Tahoua and Tillaberi compared to the previous lean season
Loss of typical pattern of ‘seasonality’ of food insecurity Seasonality of food insecurity Reminiscent of what was seen in Diffa in 2015
Food insecurity and violent events Lean season (June-August) 2014 to 2019 Violent events for January 2019 only 2019 Violent events (ACLED dataset, updated 2 Feb 2019) Total: 77 Total: 93 Total: 552 Total: 36 Total: 338
Food insecurity and climate change Lean season (June-August) 2014 to 2019 Cartes de Biomass, ACF 2018
NOTE: Price changes for key commodities can be used as an early warning tool – i.e. if HH stocks deplete earlier than expected, will lead to increased demand and result in price increases of staple foods. Thus, the viz below shows WFP FEBRUARY price variations (compared to the five-year average) for each year, except for the final price map where December 2018 is shown as the latest available data. Food insecurity and market prices Lean season (June-August) 2014 to 2019 % variation in December2018 compared to the 5 yearaverage Staple grain: Burkina Faso – Sorghum Mali & Niger – Millet
OUTILS DE VISUALISATION SUR LES TENDANCES ET FACTEURS DE l’INSECURITE ALIMENTAIRE • Sahel Food Security Trends & Drivers https://analytics.wfp.org/views/SahelFoodSecurityTrendsDrivers/Story1?iframeSizedToWindow=true&:embed=y&:showAppBanner=false&:display_count=no&:showVizHome=no • West Africa Food Security Trends https://analytics.wfp.org/views/WestAfricaFoodSecurityTrends_Adm2/NatlFoodSecTrends?iframeSizedToWindow=true&:embed=y&:showAppBanner=false&:display_count=no&:showVizHome=no
Récurrence de l’insécuritéalimentaire (5 ans de données) Niger AIC 2018 (données de 2013-2017, seuil >20% des ménages eninsecuritéalimentaire) Burkina Faso AIC 2018 (données de 2014-2018, seuil >10% des ménages eninsecuritéalimentaire) Mali AIC+ 2018 (données de 2014-2018, Seuil >22.5% des ménages eninsecuritéalimentaire)
Risque de Sécheresse(données de 1981 – 2015) Niger AIC 2018 Burkina Faso AIC 2018 Mali AIC+ 2018
Prévalence de la malnutrition AigueGlobale (GAM) Niger AIC 2018 (données de 2016) Burkina Faso AIC 2018 (données de 2013-2017) Mali AIC+ 2018 (données de 2016)
Zones de l’AIC et degradation des terres (changementecologiquesmoyens et haute propensité a l’erosion) (données de… ) Niger AIC 2018 Burkina Faso AIC 2018 Mali AIC+ 2018
Zones de l’AIC et densité de population en 2015 Niger AIC 2018 (>25 habitants par km2) Burkina Faso AIC 2018 (>45 habitants par km2) Mali AIC+ 2018 (>20 habitants par km2)
L’AIC + conflit Example 1: AIC+ Communes et zones affectées par l’insécurité, Mali 2018
L’AIC + nutrition Example 2: AIC+ recurrence MAG 2014-2018, Mali 2018