Download
1 / 12
120 likes | 350 Views
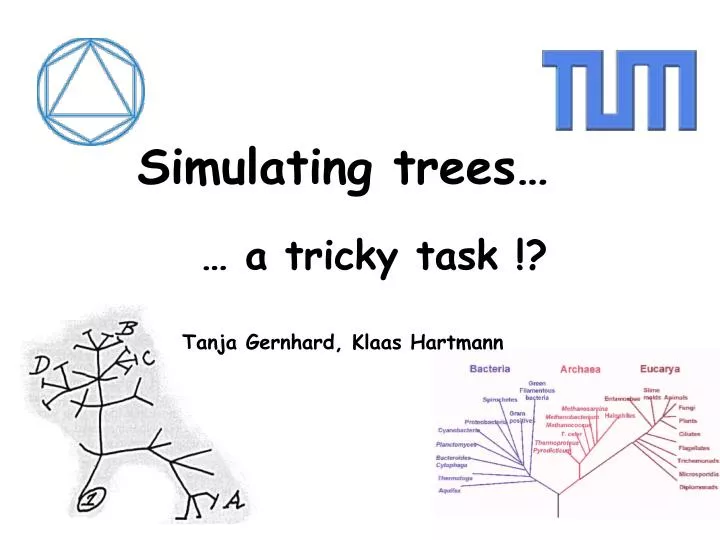
Simulating trees…. … a tricky task !? Tanja Gernhard, Klaas Hartmann . Why simulations?. How do typical trees look like under a specific model of speciation? expected Colless value? expected gamma value, LTT plot? p-values for statistical testing?.

E N D
Simulating trees… … a tricky task !? Tanja Gernhard, Klaas Hartmann
Why simulations? • How do typical trees look like under a specific model of speciation? • expected Colless value? • expected gamma value, LTT plot? • p-values for statistical testing? Even simple models hard to analyze analytically!
Aspects of simulations • Tree distribution ill-defined (expected age of the tree is infinite) • Condition on age of tree (simulations straightforward) • Condition on number of species in the tree (assuming a uniform prior for the age of the tree)
Standard method Simulate until n species are obtained. Stop at following speciation or extinction event. Example for n=5 species: • Later periods with n species disregarded! • Pendant edges are too long! • Each simulation makes same contribution!
k P Á © = i i 1 = Á Á i i General evolutionary model • Simulate a tree, t, until n* species or extinction is reached • Find the expected number of trees to sample from t: • For each sample required: • Randomly choose an interval, i, according to the weights • Choose the pendant edge length uniformly at random from (0, ) • Repeat from step 1 until the required number of samples has been obtained
Special models • Yule model: Pure birth process. Individuals evolve independently. Speciation occurs at a constant rate. • Constant rate birth-death model: Add constant death rate to the Yule model. • Coalescent: Time between successive coalescent events is exponentially distributed
¸ : s n : Memoryless pure birth models Time between sn and sn+1 does not depend on the current tree (e.g. Yule model, Coalescent). Correct simple approach: Simulate until Determine
1 1 Z Z ( ) ( j ( ) ) ( ) h ¸ h ¸ d d / g ¾ ¾ g ¾ ¾ ¾ ¾ = n n n n n n ¸ ¸ ¸ Determining .
1 Z ( ) ( ) h ¸ d / g ¾ ¾ n n ¸ 1 Z ( ) ( ) f f ¸ ¡ ¡ ( ) n ¾ n f d n n e ¾ e = = n ¸ Yule model / Coalescent Simulating until the (n+1)-th speciation event yields the desired results!
( ) ( ) ¸ ¸ 1 ¡ ¡ ¡ ¡ ¡ t t ( ) ¹ n ¹ 1 ¡ e e 2 ( j ) ( ) n ¸ ¸ t ¡ ( ) ( ) ¸ ¸ q n n ¹ ¡ ¡ ¡ ¡ t = ¸ ¹ s ¹ o r i ¡ ( ) ¸ ( ) 1 ¡ ¡ + t ¸ e ¹ e ¹ n ¡ ¹ e 2 ( j ) ( ) f ¸ t t ¡ s n ¹ = = i o r ( ) ( ) ; ¸ ¸ ( ) 2 ¡ ¡ ¡ ¡ t ¸ 1 ¹ s ¹ ¡ ¡ i ¹ e e Birth-death model reconstructed tree point process tor s3 s1 s2 s4 1 2 3 4 5
Available Program Tool TreeSample implemented in Pearl by Klaas Hartmann. Available as a stand-alone application or as a Pearl script. Demonstration:
Dankeschön Dennis Wong Mike Steel Erick Matsen Klaas Hartmann