Download
1 / 21
210 likes | 315 Views
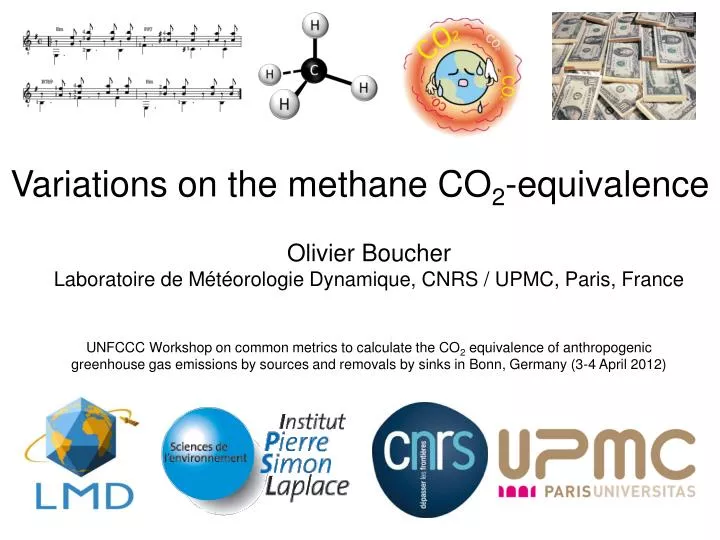
Variations on the methane CO 2 -equivalence. Olivier Boucher Laboratoire de M étéorologie Dynamique, CNRS / UPMC, Paris, France UNFCCC Workshop on common metrics to calculate the CO 2 equivalence of anthropogenic

E N D
Variations on the methane CO2-equivalence Olivier Boucher Laboratoire de Météorologie Dynamique, CNRS / UPMC, Paris, France UNFCCC Workshop on common metrics to calculate the CO2 equivalence of anthropogenic greenhouse gas emissions by sources and removals by sinks in Bonn, Germany (3-4 April 2012)
Outline • 1. Rationale • 2. Biogenic vs fossil methane • 3. Revisiting the GDP: implications for the GWP • 4. Time-evolving CO2-equivalence • 5. What metric for what usage? • 6. Conclusion
Why methane? 1. Second largest GHG in terms of RF 2. Significant anthropogenic emissions from a variety of sectors (agriculture, landfill, coal mining, conventional natural gas exploitation, shale gas exploitation) with some opportunities for mitigation 3. Multi-gas abatement strategies mostly sensitive to the methane CO2-equivalence other long-lived greenhouse gases have either too small RF (e.g. SF6 or NF3) or a pretty invariant CO2-equivalence (e.g. N2O) to really make a difference from a climate perspective.
Methane factsheet Atmospheric concentration =1800 ppbv = 1.8 ppmv (versus 380 ppmv for carbon dioxide) Radiative efficiency = 3.7 10-4 Wm-2ppbv-1 (versus 1.548 10-5 Wm-2ppbv-1 for carbon dioxide) Radiative forcing = 0.48 Wm-2 in 2005 (versus 1.66 Wm-2 for carbon dioxide) Lifetime ≈ 10 years Perturbation lifetime ≈ 12 years Indirect effects on stratospheric water vapour, ozone, CO2 and aerosols Global Warming Potential (on a mass basis) 21 initially and also in Kyoto protocol 23 in IPCC TAR (2001) 25 in IPCC AR4 (2007)
Methane cycle CO2 CO2 Biogenic methane Fossil methane CH4 CO2 CH4 Use a larger GWP for fossil methane of 27 (Boucher et al., ERL, 2009) OR Count fossil methane as CH4 and CO2 in inventories (Gillenwater, ESP, 2008)
Discount term Marginal damage caused by a pulse emission Cumulative Global Damage Potential (GDP) … revisiting Hammitt et al. (1996) and Kandlikar (1996) What damage function? exponent function hockey-stick function S-shaped (or sigmoid)
Climate metrics: from GWP to GDP RF T Discounting Linearquadratic GDP linear 100 years 28 / 30 GWP 100 years 25 / 27 GDP linear 100 years – 2% 42 / 44 GDP quadratic 100 years – 2 % 31 / 33 Integration to Integration to Linearquadratic GDP linear infinity – 2% 37 / 39 GDP quadratic Infinity – 2% 24 / 26 Quadraticcubic Linearcubic GDP cubic infinity – 2% 14 / 16
Climate metrics: from GWP to GDP RF T Discounting Linearquadratic GDP linear 100 years 28 / 30 GWP 100 years 25 / 27 GDP linear 100 years – 2% 42 / 44 GDP quadratic 100 years – 2 % 31 / 33 Integration to Integration to Linearquadratic GDP linear infinity – 2% 37 / 39 GDP quadratic Infinity – 2% 24 / 26 Quadraticcubic Linearcubic GDP cubic infinity – 2% 14 / 16
Uncertainties in methane CO2-equivalence Ozone Climate sensitivity parameters CO2 RF warming Water vapour Discount rate Methane lifetime Oxidation fraction Damage function GDP
GTP end-point 100 years 4 / 6 End-point cumulative RF T Discounting Linearquadratic GDP linear 100 years 28 / 30 GWP 100 years 25 / 27 GDP linear 100 years – 2% 42 / 44 GDP quadratic 100 years – 2 % 31 / 33 Integration to Integration to Linearquadratic GDP linear infinity – 2% 37 / 39 GDP quadratic Infinity – 2% 24 / 26 Quadraticcubic Linearcubic GDP cubic infinity – 2% 14 / 16 Climate metric: cumulative vs end-point
Time-evolving CO2-equivalence CO2-equivalence for short-lived species tend to increase as climate change increases.
Issue: CO2-equivalent emissions may go up even if individual gas emissions go down CH4 CH4 CH4 CH4 CO2 CO2 2010 2020
Solution: recalculate past emissions with new CO2-equivalence CH4 CH4 CH4 CH4 CO2 CO2 2010 2020
Multiple applications to climate metrics • Estimate the total (i.e. CO2-equivalent) GHG emissions for countries and estimate time variations • Formulate emission targets at the international level • Break down emission targets between gases within individual countries • Trade emissions in emission trading scheme (ETS) or offset emissions through the Clean Development Mechanism (CDM) • Guide investment decisions across different gases • Should we use the same climate metric for these different applications?
Methane CO2-equivalence 100-year GWP=21 ADEME, France Source: Wikipedia
Methane and the CDM From Exec board annual report 2010, Clean Development Mechanism, UNFCCC Emission reductions from CDM projects are monitored and credits are accrued year on year. Projects last for 10 years or 7 years with up to 2 renewals. Additionality does not have to be re-assessed.
Multiple applications to climate metrics Emission trading scheme / CDM - pulse metric to calculate CO2-equivalence and trade - 21 years is a long time for assuming additionality Investment decision / CDM - pulse metric - visibility on future CO2-equivalence - cost-benefit analysis (multi-year, discounting, …) CO2 equivalent emissions - pulse metric as long as on an emission trajectory - sustained metric in stabilisation regime?
Conclusions (1/2) • The 100-year GWP is comparable to an idealised GDP metric (with quadratic damage function and 2% discount rate). • An important discriminator for the methane CO2-equivalence among published climate metrics is whether the metric is cumulative or end-point (i.e. GTP vs iGTP / GWP / GDP). • For an idealised GDP, the methane CO2-equivalence is essentially determined by socio-economical parameters that involve a value judgment on impacts and discounting.
Conclusions (2/2) • There is no reason for CO2-equivalence to stay constant, eg • GTP as we approach the target for an end-point metric • GDP as climate change unfolds with a convex damage function • back-calculation of CO2-equivalent emissions • visibility on future evolution is required • Pulse emissions make sense for • - trading CH4 and CO2 on ETS and through the CDM • presenting a snapshot of a country emissions • It is less clear whether the same metric should be used to provide long-term stabilisation climate target. • transition period