Download
1 / 55
700 likes | 999 Views
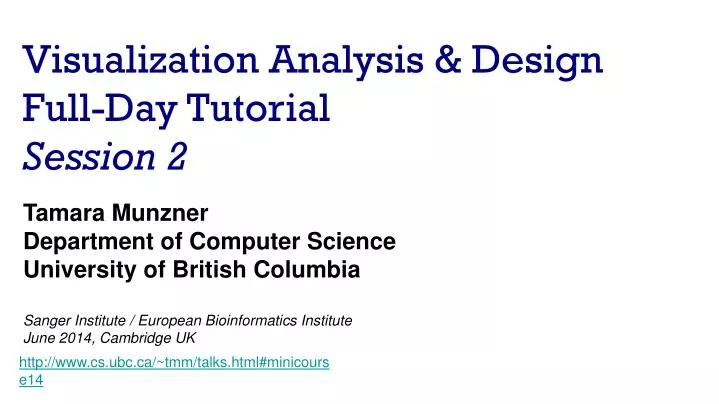
Visualization Analysis & Design Full-Day Tutorial Session 2. Tamara Munzner Department of Computer Science University of British Columbia Sanger Institute / European Bioinformatics Institute June 2014, Cambridge UK. http://www.cs.ubc.ca/~tmm/talks.html#minicourse14. Outline.

E N D
Visualization Analysis & DesignFull-Day TutorialSession 2 • Tamara Munzner • Department of Computer Science • University of British Columbia • Sanger Institute / European Bioinformatics Institute • June 2014, Cambridge UK http://www.cs.ubc.ca/~tmm/talks.html#minicourse14
Outline • Visualization Analysis FrameworkSession 1 9:30-10:45am • Introduction: Definitions • Analysis: What, Why, How • Marks and Channels • Idiom Design Choices, Part 2 Session 3 1:15pm-2:45pm • Manipulate: Change, Select, Navigate • Facet: Juxtapose, Partition, Superimpose • Reduce: Filter, Aggregate, Embed • Idiom Design Choices Session 2 11:00am-12:15pm • Arrange Tables • Arrange Spatial Data • Arrange Networks and Trees • Map Color • Guidelines and Examples Session 4 3-4:30pm • Rules of Thumb • Validation • BioVis Analysis Example http://www.cs.ubc.ca/~tmm/talks.html#minicourse14 2
Keys and values • key • independent attribute • used as unique index to look up items • simple tables: 1 key • multidimensional tables: multiple keys • value • dependent attribute, value of cell • classify arrangements by key count • 0, 1, 2, many...
Idiom: scatterplot • express values • quantitative attributes • no keys, only values • data • 2 quant attribs • mark: points • channels • horiz + vert position • tasks • find trends, outliers, distribution, correlation, clusters • scalability • hundreds of items [A layered grammar of graphics. Wickham. Journ. Computational and Graphical Statistics 19:1 (2010), 3–28.] 7
Some keys: Categorical regions • regions: contiguous bounded areas distinct from each other • using space to separate (proximity) • following expressiveness principle for categorical attributes • use ordered attribute to order and align regions
Idiom: barchart • one key, one value • data • 1 categ attrib, 1 quant attrib • mark: lines • channels • length to express quant value • spatial regions: one per mark • separated horizontally, aligned vertically • ordered by quant attrib • by label (alphabetical), by length attrib (data-driven) • task • compare, lookup values • scalability • dozens to hundreds of levels for key attrib 9
Idiom: stackedbarchart • one more key • data • 2 categ attrib, 1 quant attrib • mark: vertical stack of line marks • glyph: composite object, internal structure from multiple marks • channels • length and color hue • spatial regions: one per glyph • aligned: full glyph, lowest bar component • unaligned: other bar components • task • part-to-whole relationship • scalability • several to one dozen levels for stacked attrib [Using Visualization to Understand the Behavior of Computer Systems. Bosch. Ph.D. thesis, Stanford Computer Science, 2001.] 10
Idiom: streamgraph • generalized stacked graph • emphasizing horizontal continuity • vs vertical items • data • 1 categ key attrib (artist) • 1 ordered key attrib (time) • 1 quant value attrib (counts) • derived data • geometry: layers, where height encodes counts • 1 quant attrib (layer ordering) • scalability • hundreds of time keys • dozens to hundreds of artist keys • more than stacked bars, since most layers don’t extend across whole chart [Stacked Graphs Geometry & Aesthetics. Byron and Wattenberg. IEEE Trans. Visualization and Computer Graphics (Proc. InfoVis 2008) 14(6): 1245–1252, (2008).] 11
Idiom: linechart • one key, one value • data • 2 quant attribs • mark: points • line connection marks between them • channels • aligned lengths to express quant value • separated and ordered by key attrib into horizontal regions • task • find trend • connection marks emphasize ordering of items along key axis by explicitly showing relationship between one item and the next 12
Choosing bar vs line charts • depends on type of key attrib • bar charts if categorical • line charts if ordered • do not use line charts for categorical key attribs • violates expressiveness principle • implication of trend so strong that it overrides semantics! • “The more male a person is, the taller he/she is” after [Bars and Lines: A Study of Graphic Communication. Zacks and Tversky. Memory and Cognition 27:6 (1999), 1073–1079.]
Idiom: heatmap • two keys, one value • data • 2 categ attribs (gene, experimental condition) • 1 quant attrib (expression levels) • marks: area • separate and align in 2D matrix • indexed by 2 categorical attributes • channels • color by quant attrib • (ordered diverging colormap) • task • find clusters, outliers • scalability • 1M items, 100s of categ levels, ~10 quant attrib levels 14
Idiom: cluster heatmap • in addition • derived data • 2 cluster hierarchies • dendrogram • parent-child relationships in tree with connection line marks • leaves aligned so interior branch heights easy to compare • heatmap • marks (re-)ordered by cluster hierarchy traversal 15
Idioms: scatterplot matrix, parallel coordinates • scatterplot matrix (SPLOM) • rectilinear axes, point mark • all possible pairs of axes • scalability • one dozen attribs • dozens to hundreds of items • parallel coordinates • parallel axes, jagged line representing item • rectilinear axes, item as point • axis ordering is major challenge • scalability • dozens of attribs • hundreds of items after [Visualization Course Figures. McGuffin, 2014. http://www.michaelmcguffin.com/courses/vis/]
Task: Correlation • scatterplot matrix • positive correlation • diagonal low-to-high • negative correlation • diagonal high-to-low • uncorrelated • parallel coordinates • positive correlation • parallel line segments • negative correlation • all segments cross at halfway point • uncorrelated • scattered crossings [A layered grammar of graphics. Wickham. Journ. Computational and Graphical Statistics 19:1 (2010), 3–28.] [Hyperdimensional Data Analysis Using Parallel Coordinates. Wegman. Journ. American Statistical Association 85:411 (1990), 664–675.] 18
Idioms: radial bar chart, star plot • radial bar chart • radial axes meet at central ring, line mark • star plot • radial axes, meet at central point, line mark • bar chart • rectilinear axes, aligned vertically • accuracy • length unaligned with radial • less accurate than aligned with rectilinear [Vismon: Facilitating Risk Assessment and Decision Making In Fisheries Management. Booshehrian, Möller, Peterman, and Munzner. Technical Report TR 2011-04, Simon Fraser University, School of Computing Science, 2011.] 19
Idioms: pie chart, polar area chart • pie chart • area marks with angle channel • accuracy: angle/area much less accurate than line length • polar area chart • area marks with length channel • more direct analog to bar charts • data • 1 categ key attrib, 1 quant value attrib • task • part-to-whole judgements [A layered grammar of graphics. Wickham. Journ. Computational and Graphical Statistics 19:1 (2010), 3–28.] 20
Idioms: normalized stacked bar chart • task • part-to-whole judgements • normalized stacked bar chart • stacked bar chart, normalized to full vert height • single stacked bar equivalent to full pie • high information density: requires narrow rectangle • pie chart • information density: requires large circle http://bl.ocks.org/mbostock/3887235,http://bl.ocks.org/mbostock/3886208, http://bl.ocks.org/mbostock/3886394. 21
Idiom: glyphmaps • rectilinear good for linear vs nonlinear trends • radial good for cyclic patterns [Glyph-maps for Visually Exploring Temporal Patterns in Climate Data and Models. Wickham, Hofmann, Wickham, and Cook. Environmetrics 23:5 (2012), 382–393.]
Orientation limitations • rectilinear: scalability wrt #axes • 2 axes best • 3 problematic • more in afternoon • 4+ impossible • parallel: unfamiliarity, training time • radial: perceptual limits • angles lower precision than lengths • asymmetry between angle and length • can be exploited! [Uncovering Strengths and Weaknesses of Radial Visualizations - an Empirical Approach. Diehl, Beck and Burch. IEEE TVCG (Proc. InfoVis) 16(6):935--942, 2010.]
Further reading • Visualization Analysis and Design. Munzner. AK Peters / CRC Press, Oct 2014. • Chap 7: Arrange Tables • Visualizing Data. Cleveland. Hobart Press, 1993. • A Brief History of Data Visualization. Friendly. 2008.http://www.datavis.ca/milestones 24
Outline • Visualization Analysis FrameworkSession 1 9:30-10:45am • Introduction: Definitions • Analysis: What, Why, How • Marks and Channels • Idiom Design Choices, Part 2 Session 3 1:15pm-2:45pm • Manipulate: Change, Select, Navigate • Facet: Juxtapose, Partition, Superimpose • Reduce: Filter, Aggregate, Embed • Idiom Design Choices Session 2 11:00am-12:15pm • Arrange Tables • Arrange Spatial Data • Arrange Networks and Trees • Map Color • Guidelines and Examples Session 4 3-4:30pm • Rules of Thumb • Validation • BioVis Analysis Example http://www.cs.ubc.ca/~tmm/talks.html#minicourse14 25
Idiom: choropleth map • use given spatial data • when central task is understanding spatial relationships • data • geographic geometry • table with 1 quant attribute per region • encoding • use given geometry for area mark boundaries • sequential segmented colormap http://bl.ocks.org/mbostock/4060606
Idiom: topographic map • data • geographic geometry • scalar spatial field • 1 quant attribute per grid cell • derived data • isoline geometry • isocontours computed for specific levels of scalar values Land Information New Zealand Data Service
Idiom: isosurfaces • data • scalar spatial field • 1 quant attribute per grid cell • derived data • isosurface geometry • isocontours computed for specific levels of scalar values • task • spatial relationships [Interactive Volume Rendering Techniques. Kniss. Master’s thesis, University of Utah Computer Science, 2002.]
Idioms: DVR, multidimensional transfer functions • direct volume rendering • transfer function maps scalar values to color, opacity • no derived geometry • multidimensional transfer functions • derived data in joint 2D histogram • horiz axis: data values of scalar func • vert axis: gradient magnitude (direction of fastest change) • [more on cutting planes and histograms later] [Multidimensional Transfer Functions for Volume Rendering. Kniss, Kindlmann, and Hansen. In The Visualization Handbook, edited by Charles Hansen and Christopher Johnson, pp. 189–210. Elsevier, 2005.]
Vector and tensor fields • data • many attribs per cell • idiom families • flow glyphs • purely local • geometric flow • derived data from tracing particle trajectories • sparse set of seed points • texture flow • derived data, dense seeds • feature flow • global computation to detect features • encoded with one of methods above [Comparing 2D vector field visualization methods: A user study. Laidlaw et al. IEEE Trans. Visualization and Computer Graphics (TVCG) 11:1 (2005), 59–70.] [Topology tracking for the visualization of time-dependent two-dimensional flows. Tricoche, Wischgoll, Scheuermann, and Hagen. Computers & Graphics 26:2 (2002), 249–257.] 31
Vector fields • empirical study tasks • finding critical points, identifying their types • identifying what type of critical point is at a specific location • predicting where a particle starting at a specified point will end up (advection) [Comparing 2D vector field visualization methods: A user study. Laidlaw et al. IEEE Trans. Visualization and Computer Graphics (TVCG) 11:1 (2005), 59–70.] [Topology tracking for the visualization of time-dependent two-dimensional flows. Tricoche, Wischgoll, Scheuermann, and Hagen. Computers & Graphics 26:2 (2002), 249–257.] 32
Idiom: similarity-clustered streamlines • data • 3D vector field • derived data (from field) • streamlines: trajectory particle will follow • derived data (per streamline) • curvature, torsion, tortuosity • signature: complex weighted combination • compute cluster hierarchy across all signatures • encode: color and opacity by cluster • tasks • find features, query shape • scalability • millions of samples, hundreds of streamlines [Similarity Measures for Enhancing Interactive Streamline Seeding. McLoughlin,. Jones, Laramee, Malki, Masters, and. Hansen. IEEE Trans. Visualization and Computer Graphics 19:8 (2013), 1342–1353.] 33
Further reading • Visualization Analysis and Design. Munzner. AK Peters / CRC Press, Oct 2014. • Chap 8: Arrange Spatial Data • How Maps Work: Representation, Visualization, and Design. MacEachren. Guilford Press, 1995. • Overview of visualization. Schroeder and. Martin. In The Visualization Handbook, edited by Charles Hansen and Christopher Johnson, pp. 3–39. Elsevier, 2005. • Real-Time Volume Graphics. Engel, Hadwiger, Kniss, Reza-Salama, and Weiskopf. AK Peters, 2006. • Overview of flow visualization. Weiskopf and Erlebacher. In The Visualization Handbook, edited by Charles Hansen and Christopher Johnson, pp. 261–278. Elsevier, 2005.
Outline • Visualization Analysis FrameworkSession 1 9:30-10:45am • Introduction: Definitions • Analysis: What, Why, How • Marks and Channels • Idiom Design Choices, Part 2 Session 3 1:15pm-2:45pm • Manipulate: Change, Select, Navigate • Facet: Juxtapose, Partition, Superimpose • Reduce: Filter, Aggregate, Embed • Idiom Design Choices Session 2 11:00am-12:15pm • Arrange Tables • Arrange Spatial Data • Arrange Networks and Trees • Map Color • Guidelines and Examples Session 4 3-4:30pm • Rules of Thumb • Validation • BioVis Analysis Example http://www.cs.ubc.ca/~tmm/talks.html#minicourse14 35
Idiom: force-directed placement • visual encoding • link connection marks, node point marks • considerations • spatial position: no meaning directly encoded • left free to minimize crossings • proximity semantics? • sometimes meaningful • sometimes arbitrary, artifact of layout algorithm • tension with length • long edges more visually salient than short • tasks • explore topology; locate paths, clusters • scalability • node/edge density E < 4N http://mbostock.github.com/d3/ex/force.html
Idiom: sfdp (multi-level force-directed placement) • data • original: network • derived: cluster hierarchy atop it • considerations • better algorithm for same encoding technique • same: fundamental use of space • hierarchy used for algorithm speed/quality but not shown explicitly • (more on algorithm vs encoding in afternoon) • scalability • nodes, edges: 1K-10K • hairball problem eventually hits [Efficient and high quality force-directed graph drawing. Hu. The Mathematica Journal 10:37–71, 2005.] http://www.research.att.com/yifanhu/GALLERY/GRAPHS/index1.html
Idiom: adjacency matrix view • data: network • transform into same data/encoding as heatmap • derived data: table from network • 1 quant attrib • weighted edge between nodes • 2 categ attribs: node list x 2 • visual encoding • cell shows presence/absence of edge • scalability • 1K nodes, 1M edges [NodeTrix: a Hybrid Visualization of Social Networks. Henry, Fekete, and McGuffin. IEEE TVCG (Proc. InfoVis) 13(6):1302-1309, 2007.] [Points of view: Networks. Gehlenborg and Wong. Nature Methods 9:115.] 39
Connection vs. adjacency comparison • adjacency matrix strengths • predictability, scalability, supports reordering • some topology tasks trainable • node-link diagram strengths • topology understanding, path tracing • intuitive, no training needed • empirical study • node-link best for small networks • matrix best for large networks • if tasks don’t involve topological structure! http://www.michaelmcguffin.com/courses/vis/patternsInAdjacencyMatrix.png [On the readability of graphs using node-link and matrix-based representations: a controlled experiment and statistical analysis. Ghoniem, Fekete, and Castagliola. Information Visualization 4:2 (2005), 114–135.] 40
Idiom: radial node-link tree • data • tree • encoding • link connection marks • point node marks • radial axis orientation • angular proximity: siblings • distance from center: depth in tree • tasks • understanding topology, following paths • scalability • 1K - 10K nodes http://mbostock.github.com/d3/ex/tree.html 41
Idiom: treemap • data • tree • 1 quant attrib at leaf nodes • encoding • area containment marks for hierarchical structure • rectilinear orientation • size encodes quant attrib • tasks • query attribute at leaf nodes • scalability • 1M leaf nodes http://tulip.labri.fr/Documentation/3_7/userHandbook/html/ch06.html 42
Link marks: Connection and Containment • marks as links (vs. nodes) • common case in network drawing • 1D case: connection • ex: all node-link diagrams • emphasizes topology, path tracing • networks and trees • 2D case: containment • ex: all treemap variants • emphasizes attribute values at leaves (size coding) • only trees [Elastic Hierarchies: Combining Treemaps and Node-Link Diagrams. Dong, McGuffin, and Chignell. Proc. InfoVis 2005, p. 57-64.]
Tree drawing idioms comparison • data shown • link relationships • tree depth • sibling order • design choices • connection vs containment link marks • rectilinear vs radial layout • spatial position channels • considerations • redundant? arbitrary? • information density? • avoid wasting space [Quantifying the Space-Efficiency of 2D Graphical Representations of Trees. McGuffin and Robert. Information Visualization 9:2 (2010), 115–140.]
Idiom: GrouseFlocks • data: compound graphs • network • cluster hierarchy atop it • derived or interactively chosen • visual encoding • connection marks for network links • containment marks for hierarchy • point marks for nodes • dynamic interaction • select individual metanodes in hierarchy to expand/contract [GrouseFlocks: Steerable Exploration of Graph Hierarchy Space. Archambault, Munzner, and Auber. IEEE TVCG 14(4):900-913, 2008.]
Further reading • Visualization Analysis and Design. Munzner. AK Peters / CRC Press, Oct 2014. • Chap 9: Arrange Networks and Trees • Visual Analysis of Large Graphs: State-of-the-Art and Future Research Challenges. von Landesberger et al. Computer Graphics Forum 30:6 (2011), 1719–1749. • Simple Algorithms for Network Visualization: A Tutorial. McGuffin. Tsinghua Science and Technology (Special Issue on Visualization and Computer Graphics) 17:4 (2012), 383–398. • Drawing on Physical Analogies. Brandes. In Drawing Graphs: Methods and Models, LNCS Tutorial, 2025, edited by M. Kaufmann and D. Wagner, LNCS Tutorial, 2025, pp. 71–86. Springer-Verlag, 2001. • Treevis.net: A Tree Visualization Reference. Schulz. IEEE Computer Graphics and Applications 31:6 (2011), 11–15. http://www.treevis.net • Perceptual Guidelines for Creating Rectangular Treemaps. Kong, Heer, and Agrawala. IEEE Trans. Visualization and Computer Graphics (Proc. InfoVis) 16:6 (2010), 990–998.
Outline • Visualization Analysis FrameworkSession 1 9:30-10:45am • Introduction: Definitions • Analysis: What, Why, How • Marks and Channels • Idiom Design Choices, Part 2 Session 3 1:15pm-2:45pm • Manipulate: Change, Select, Navigate • Facet: Juxtapose, Partition, Superimpose • Reduce: Filter, Aggregate, Embed • Idiom Design Choices Session 2 11:00am-12:15pm • Arrange Tables • Arrange Spatial Data • Arrange Networks and Trees • Map Color • Guidelines and Examples Session 4 3-4:30pm • Rules of Thumb • Validation • BioVis Analysis Example http://www.cs.ubc.ca/~tmm/talks.html#minicourse14 47
Color: Luminance, saturation, hue • 3 channels • what/where for categorical • hue • how-much for ordered • luminance • saturation • other common color spaces • RGB: poor choice for visual encoding • HSL: better, but beware • lightness ≠ luminance • transparency • useful for creating visual layers • but cannot combine with luminance or saturation 48
Colormaps • categorical limits: noncontiguous • 6-12 bins hue/color • far fewer if colorblind • 3-4 bins luminance, saturation • size heavily affects salience • use high saturation for small regions, low saturation for large after [Color Use Guidelines for Mapping and Visualization. Brewer, 1994. http://www.personal.psu.edu/faculty/c/a/cab38/ColorSch/Schemes.html]
Categorical color: Discriminability constraints • noncontiguous small regions of color: only 6-12 bins [Cinteny: flexible analysis and visualization of synteny and genome rearrangements in multiple organisms. Sinha and Meller. BMC Bioinformatics, 8:82, 2007.]