Download
1 / 17
170 likes | 264 Views
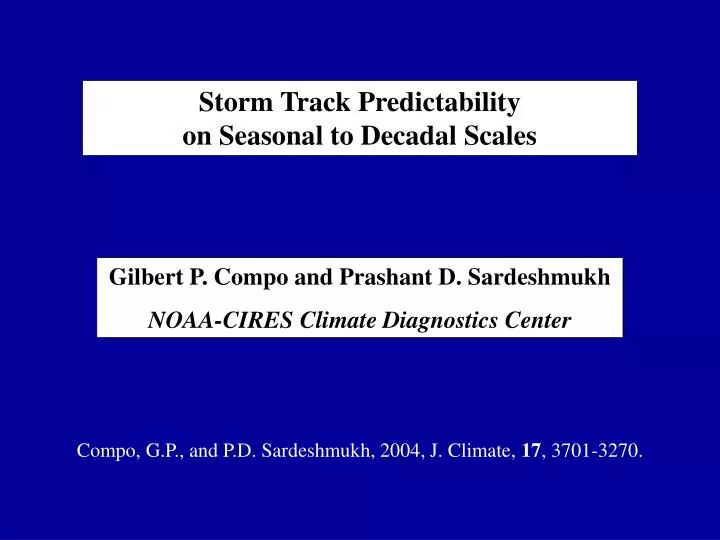
Storm Track Predictability on Seasonal to Decadal Scales. Gilbert P. Compo and Prashant D. Sardeshmukh NOAA-CIRES Climate Diagnostics Center. Compo, G.P., and P.D. Sardeshmukh, 2004, J. Climate, 17 , 3701-3270. Outline.

E N D
Storm Track Predictability on Seasonal to Decadal Scales Gilbert P. Compo and Prashant D. Sardeshmukh NOAA-CIRES Climate Diagnostics Center Compo, G.P., and P.D. Sardeshmukh, 2004, J. Climate, 17, 3701-3270.
Outline • ENSO has a significant effect on interannual variability of Northern Hemisphere storm tracks (Fraedrich 1990; Hoerling and Ting 1994; Strauss and Shukla 1997; May and Bengtsson 1998; Compo et al. 2001) • Studying predictability and storm tracks • Storm Track Model • Actual and expected skill for predicting storm track anomalies • Decadal storm track anomalies • Observed versus expected skill
Data and Method NCEP MRF9: T40L18 JFM integrations: Climatological and actual and idealized ENSO 570 members 1950-94 integrations: Global SSTs (GOGA) 13 members (monthly) 30oN-30oS Pacific SSTs (POGA) 9 members NCAR CCM3:T42L18 1950-99 integrations: Global SSTs (GOGA) 12 members (monthly) Tropical SSTs (TOGA) 11 members NASA NSIPP: 144X90 L34 {96X80 L34} 1948-04 integrations: GOGA 9 members 1948-03 : {GOGA} 14 members 1948-99 : {GOGA with greenhouse gases} 8 members IRI ECHAM4.5 :T42L19 1950-03 integrations: GOGA 24 members NCEP-NCAR reanalysis dataset:T62L28 1948-04 Storm tracks are computed directly from Fourier power spectrum summed over 2.0 to 6.9 days and are also computed using an Empirical Storm Track Model.
OBS GCM ENSO has a significant effect on stormtracks El Nino anomalous stormtracks (JFM) 2 to 7 day standard deviation C.I. 8m 500 mb height 500 mb vertical velocity () C.I. ~20mb/day 11-events 1987 SSTs 60-members from Compo, Sardeshmukh, and Penland (J. Climate 2001). Is it predictable?
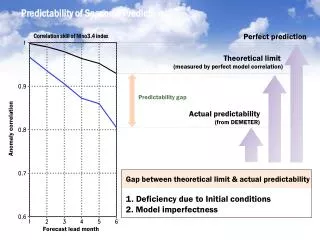
0.53 Combined PDF and rho-infinity Signal 0.5 Predict • ability The ability to predict a different range of possibilities than the climatological range 27 % 3 % Expected forecast skill as a function of signal to noise ratio from Sardeshmukh, Compo, and Penland (J.Climate 2000)
An Empirical Linear Storm Track Model (STM) y = Gx + e x = winter mean 200 mb height anomalies (40 EOFs) y = winter mean storm track anomalies (50 EOFs) (anomalous variance of 2-to-7 day filtered 500 mb w) G is estimated from large (570-member) ensembles of seasonal NCEP GCM runs with climatological mean SSTs and also observed and idealized ENSO SST forcing. Chang and Fu (2003), Peng et al (2003), Compo and Sardeshmukh (2004)
Design of Study • The linear STM is first tested for its ability to reproduce the nonlinear NCEP GCM’s • (60-member) ensemble-mean storm track responses to warm and cold ENSO SST • forcing in 1987 and 1989, given only the GCM’s ensemble-mean 200 mb height responses. • It is then used to predict observed winter-mean and 5-winter-mean storm track anomalies • during 1950-1999, given : • The observed 200 mb height anomalies, and • The NCEP and NCAR GCMs’ (~12-member) ensemble-mean 200 mb height • responses to • (a) anomalous Global SST forcing (GOGA), and • (b) anomalous Tropical SST forcing (TOGA) • These predicted storm anomalies are interpreted as the “predictable” SST-forced • part of the anomalous storm track in each winter and 5-winter mean.
Testing the linear STM 1987 El Nino 1989 La Nina GCM’s 60-member ensemble mean 200 mb height response Linear STM’s 500 mb w Storm track response GCM’s ensemble-mean 500 mb w Storm track response 0.9 0.9 C.I. 20 m for height, ~ 10 mb/day for storm track
0.70 0.55 0.40 0.25 Correlation of winter mean and model storm track Skill of winter-mean storm track anomaly “predictions” made by the linear STM Predictable part is associated mostly with tropical SST forcing using observed 200mb height using GCM ensemble mean 200mb height CI: 0.15 Starting at 0.25 Global SSTs Tropical SSTs
0.70 0.55 0.40 CCM 0.25 MRF SST-forced storm track predictability (local anomaly correlation) 1987 El Nino x=SST forced 200 mb Z y=Gx 50 winters 1989 La Nina 60 MRF members GCM sensitivity Case dependence
OBS GOGA TOGA Skill in Predicting Observed Anomalous Storm Tracks PNA Sector Skill of GOGA and TOGA significant and strongly associated with ENSO. North-Atlantic/Europe Lesser skill 5% More skillful years than just ENSO over PNA (26).
Decadal storm track anomalies Decadal storm track variations reported in several studies (Hurrell and van Loon 1997, Graham and Diaz 2001, Chang and Fu 2002, 2003, Harnik and Chang 2003). Omega stormtrack not reported. Relationship to global SST variations not reported. Use STM to examine consistency between GCM and observed 5-winter mean stormtrack anomalies.
OBS GOGA TOGA Skill in Simulating 5-winter mean Observed Stormtracks PNA Sector Skill of GOGA and TOGA significant and strongly associated with low-frequency ENSO. North-Atlantic/Europe No significant skill 5%
Observed vs expected skillfor Northern Hemisphere Storm Track Anomalies In Pacific sector, actual skill is consistent with signal to noise ratios but not in Atlantic sector…. Is this because of errors in: 1. Storm Track Model, or 2. GCMs’ 200 mb Z response in the Atlantic? Latter is more likely, given the STM’s reproduction of the GCM’s ensemble mean Atlantic storm tracks in 1987 and 1989. Symbols show actual pattern correlations
0.70 0.55 ECHAM CCM 0.40 0.25 NSIPP ECHAM SST-forced storm track skill is very similar in older and newer GCMs… x=SST forced 200 mb Z y=Gx 50+ winters 12 members 12 members Local anomaly correlation
But actual skill of newer models is not necessarily more consistent with signal to noise ratios! MRF9 CCM3 For newer models, In Pacific sector, actual skill is consistent with signal to noise ratios only for large S and not at all in Atlantic sector…. ECHAM NSIPP Symbols show actual pattern correlations
Summary • Our linear STM can reproduce a nonlinear GCM’s storm track response to ENSO, given only the GCM’s 200 mb height response. • 2. The linear STM has been used to estimate the local and regional predictability of winter-mean and 5-winter-mean storm track • anomalies. There is substantial predictability in the Pacific sector, much less so in the Atlantic sector. • 3. Most of this predictability is associated with tropical SST forcing. • The predictability estimates are more reliable in the Pacific than • in the Atlantic sector, where they are inconsistent with estimated signal to noise ratios, even for newer models.