Download
1 / 20
200 likes | 347 Views
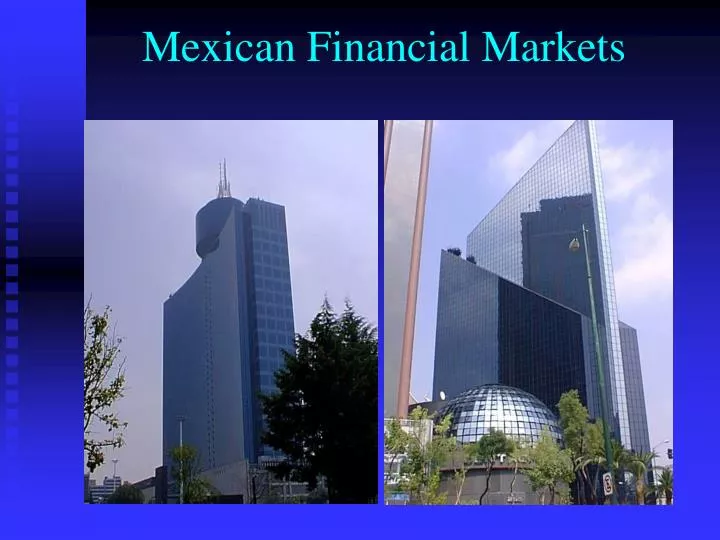
Mexican Financial Markets. Mexico’s Economic: Highlights. GDP: $621 B Largest in Latin America 12 th largest of the World 8 th Largest exporter of the world 4 th Largest producer of oil. Economic Development 1950-1999. The Mexican Miracle: 1950-1970.

E N D
Mexico’s Economic: Highlights • GDP: $621 B • Largest in Latin America • 12th largest of the World • 8th Largest exporter of the world • 4th Largest producer of oil
The Mexican Miracle: 1950-1970 • Average growth: 6.7% Inflation: 4.2% • Fiscal and Monetary Discipline • Growth based on import substitution • Investment in infrastructure
The Downturn: 1970-1982 • Average growth: 6.2% Inflation: 23.8% • New oil reserves found • Growth based on government spending • Government debt grew dramatically • Ended with the 1982 crisis: • Government defaulted on its debt • Dramatic devaluation of the peso
Adjustment: 1982-1988 • Average growth: 0.0% Inflation: 94.6% • Priority inflation abatement • Fiscal Discipline • Beginning of privatization and of transition to an open economy (GATT)
The Salina’s Years: 1988-1994 • Average growth: 0.0% Inflation: 94.6% • The “Pactos” • Structural Reforms: • Privatization • Free trade • Renegotiation of external debt “Brady plan”
Salinas Years: Results • Pactos were effective controlling inflation • 1987: 159.2% vs 1994: 7.1% • At the same time GDP grew 3.3% in 1994 • Exports were more than double those in 1987 reaching $61 B
What went wrong? 1994 Crisis • A widening of the current account deficit that reached almost 8% of GDP • Strong appreciation of the Real Exchange Rate • Diminishing domestic savings rate (15% of GDP in 1994) • While financing to the public sector was growing extremely fast (from 5% of GDP in 1987 to 45% in 1994) • Political assassinations and uprising in Chiapas
Zedillo’s Years: 1994-2000 • New stabilization plan • Refinance short term debt • Rescue the banking sector • Economic growth resumed in 1996 and was strong until 2000 • Inflation lowered to historical levels
Challenges going forward • Fiscal reform: • Reduce fiscal evasion • Reduce dependence on oil • Electric sector reform • Reduce dependence on US economy • Extremely unequal income distribution
Mexican Stock Exchange • Founded in 1886 • The Stock Market Law in 1975 triggered the development of the Mexican Stock Exchange • The devaluation of 1976 also helped to develop the market • Great performance until 1982 crisis
Mexican Stock Exchange • Market cap grew from 3% of GDP in 1982 to 45% in 1994 • Over that period there were 76 IPO’s • The government also helped developed the market: • Fondo Mexico • Privatizations
Why this happened? • Corporate Governance Issues • Absence of Institutional Investors • Mexican firms migrated to other markets • New Reforms to the Law of Stock Market Law(2001): • Improve protection to investors • Increase transparency • Access to the great public to capital markets