Download
1 / 22
220 likes | 391 Views
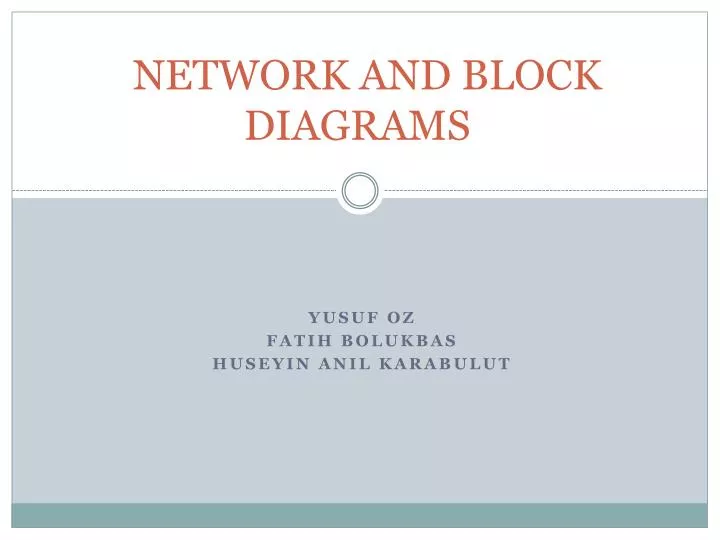
NETWORK AND BLOCK DIAGRAMS. YUSUF OZ FATIH BOLUKBAS HUSEYIN ANIL KARABULUT. What is Project Network Diagram?. A project network diagram is a pictorial representation of the sequence in which the project can be done. Developed in the 1950’ to overcome the shortcoming of the Gantt Chart.

E N D
NETWORK AND BLOCK DIAGRAMS YUSUF OZ FATIH BOLUKBAS HUSEYIN ANIL KARABULUT
What is Project Network Diagram? • A project network diagram is a pictorial representation of the sequence in which the project can be done. • Developed in the 1950’ to overcome the shortcoming of the Gantt Chart.
Superiority over Gantt Chart: • Displays detailed information on each work unit • Clearly reflects the order of tasks in multiple phases • Reflects the shortest path to completion • Reflects the best usage of resource
Helps of Network Diagrams Network diagrams help us in following way: • Finds our critical / non-critical activities. • Understand the types of activity dependencies and when they are used.
Ideal Situations of Network Diagrams Network Diagrams are ideal for these situations: • Detailed project management • Implementation tracking • Contingency plans • Resource control
Types of Network Diagram • Arrow diagram (AOA – Activity on Arrow) • Precedence diagram (AON – Activity on Node)
FS = Finish to StartSS = Start to StartFF = Finish to FinishSF = Start to Finish Dependency
ARROW DIAGRAMS • The arrow diagram shows the required order of tasks in a project or process • The arrow diagram lets you calculate the “critical path” of the project
WHEN TO USE ARROW DIAGRAMS • When scheduling and monitoring tasks of a complex project with interrelated tasks and resources. • When you know the steps of the project or process • When project schedule is critical, with serious results for completing the project late or early
ARROW DIAGRAM PROCEDURE • List all the necessary tasks in the project or process • Determine the correct sequence of the tasks • Diagram the network of tasks • Between each two tasks, draw circles for “events.” • Look for three common problem situations and redraw them using “dummies” or extra events
DUMMY ACTIVITY? • A dummy is an arrow drawn with dotted lines used to separate tasks that would otherwise start and stop with the same events or to show logical sequence Dummy separating simultaneous tasks
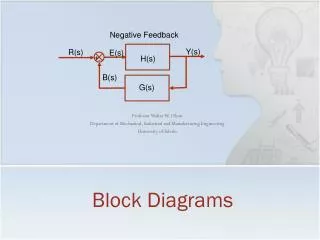
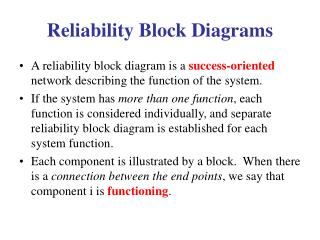
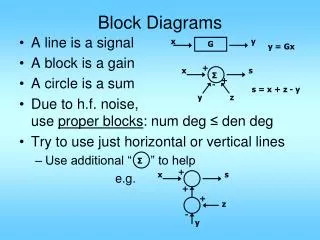
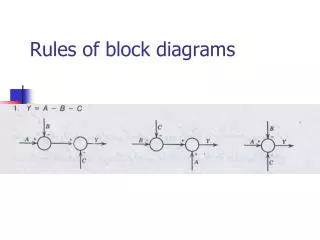
BLOCK DIAGRAMS The block diagram is a simple pictorial representation of a system or sub-systems to illustrate the relationships between sub-systems.
IMPORTANCE OF BLOCK DIAGRAMS • Identification the system • Visualization the system
WHEN TO USE BLOCK DIAGRAMS? • Establish the boundaries of a system under consideration • Outline the elements contained within the scope of a task • Identify inputs and outputs for components within a system • Identify relationships between systems or components • Establish critical paths through systems
HOW TO USE BLOCK DIAGRAMS? • Construct the initial diagram using pencil and paper then transfer to the computer • Space blocks far apart, leave enough space to add more blocks when needed • Start at the input to the system and follow the path
Requirements Interfaces – Internal & External Elements System Contributors / Other Aspects
Process makes it possible, people make it happen.
REFERENCES • http://www.super-business.net/IT-Project-Management/172.html • http://www.michelbeauregard.com/msProjectnetworkDiagram.pdf • http://thequalityportal.com/q_block.htm