Download
1 / 5
50 likes | 213 Views
Least Squares Regression Facts and r 2. AP Statistics. The coefficient of determination, r 2. The fraction of the variation in the values of y that is explained by least squares regression of y on x. Facts about least squares regression:.

E N D
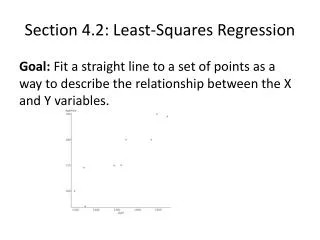
Least Squares Regression Facts and r2 AP Statistics
The coefficient of determination, r2 • The fraction of the variation in the values of y that is explained by least squares regression of y on x.
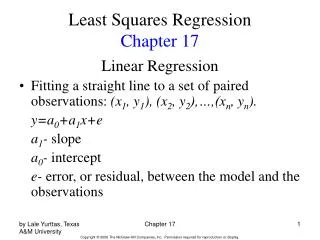
Facts about least squares regression: • Fact 1: The distinction between explanatory and response variables is essential . If we reverse the roles of the variables x and y, we get a different least squares regression line. • Fact 2: There is a close relationship between correlation and the slope of the least-squares regression line. A change of one standard deviation in x corresponds to a change of r standard deviations in y. • Fact 3: The least squares regression line always passes through the point containing the mean of x and y. ( , ) • Fact 4: The correlation r describes the strength of a straight line relationship. In the regression setting, the description takes a specific form: the square of the correlation r2 is the fraction of the variation in the values of y that is explained by the least squares regression of y on x.
3.45 p. 166-167 Beavers and BeetlesEcologists sometimes find rather strange relationships in our environment. One study seems to show that beavers benefit beetles. The researchers laid out 23 circular plots, each four meters in diameter, in an area where beavers were cutting down cottonwood trees. In each plot they counted the number of stumps from trees ct down by beavers and the number of clusters of beetle larvae. Here are the data: • Stumps: 2 2 1 3 3 4 3 1 2 5 • Beetle: 10 30 12 24 36 40 4 3 11 27 56 Larvae • Stumps: 1 3 2 1 2 2 1 1 4 1 • Beetle 18 40 25 8 21 14 16 6 54 9 Larvae: • Stumps: 2 1 4 • Beetle 13 14 50 Larvae: • Make a scatterplot that shows how the number of beaver-caused stumps influences the number of beetle larvae clusters. What does your plot show? • FIRST OF ALL. WHAT IS THE EXPLANATORY VARIABLE? The beaver caused stumps • THE RESPONSE VARIABLE? The number of beetle larvae clusters. • The plot shows a positive linear association.
3.45 p. 166-167 Beavers and Beetles CONTINUEDEcologists sometimes find rather strange relationships in our environment. One study seems to show that beavers benefit beetles. The researchers laid out 23 circular plots, each four meters in diameter, in an area where beavers were cutting down cottonwood trees. In each plot they counted the number of stumps from trees ct down by beavers and the number of clusters of beetle larvae. Here are the data: • b. Find the least squares regression line and draw it on your plot. • The least squares regression line is • predicted number of beetle larvae clusters = -1.286 + 11.89 ( number of stumps) • Or in terms of variables • C. What percent of the observed variation in beetle larvae counts can be explained by straight line dependence on stump counts? • The straight line relationship explains r2 = 83.9 % of the variation between beetle larvae.