Download
1 / 40
410 likes | 555 Views
parameters correlated. parameters not correlated. Correlation Matrix: TP Metro , Trophic State Metrics, and Forms of P. Bible Study. “And I looked, and behold a pale horse: and his name that sat on him was Death, and Hell followed with him.”. As Considered Here ….

E N D
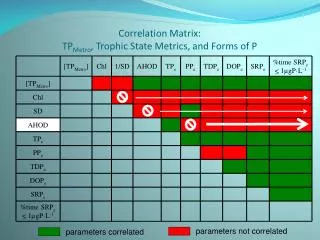
parameters correlated parameters not correlated Correlation Matrix:TPMetro, Trophic State Metrics, and Forms of P
Bible Study “And I looked, and behold a pale horse: and his name that sat on him was Death, and Hell followed with him.”
As Considered Here … “And I looked, and behold a pale horse: and his name that sat on him was AHOD, and Hell followed with him.”
SINS OF THE MOTHERS AND FATHERS: WHITHER REDEMPTION? UNTO HOW MANY GENERATIONS: LEGACY ORGANIC CARBON IN ONONDAGA LAKE SEDIMENTS Martin T. Auer, Phillip A. DePetro,and Kevin A. Bierlein Department of Civil & Environmental Engineering Michigan Technological University Steven C. Chapra Department of Civil & Environmental Engineering Tufts University 11th Onondaga Lake Scientific Forum, Syracuse, New York, November 2009
Why? what extent Concentration when Time The question is not whether lakes will improve following external loading reductions, but when and to what extent. Restoration & Management of Lakes and Reservoirs; Cooke et al. (2005)
It’s the Slow Eigenvalue, Stupid flushing with a rapid flushing rate, the fast eigenvalue for Onondaga Lake is fast indeed. water sediment the slow eigenvalue … not so much. burial
Eigenvalues and Lake Recovery flushing water Csediment Cwater fast eigenvalue effect slow eigenvalue effect sediment Time (yr) burial
Whatever Became of Shagawa Lake? • water column TP of 50 ppb • tertiary treatment reduced load by 80% Shagawa Lake • a fast eigenvalue-based model predicted that water column TP would reach 12.5 ppb within 1.5 years Ely, Minnesota • not so much; • they missed the slow eigenvalue Larsen, D.P. and Malueg, K.W. 1980. Whatever became of Shagawa Lake? pp. 67-72, In: Restoration of Lakes and Inland Waters, U.S. Environmental Protection Agency.
Whatever Became of Shagawa Lake? Shagawa Lake Ely, Minnesota “supply from the sediments had not diminished since treatment began … further recovery … will depend upon how long feedback from the sediments continues.” Chapra, S.C. and R.P. Canale. 1991. Long-term phenomenological model of phosphorus and oxygen in stratified lakes. Water Research, 25(6): 707-715.
So … What’s in the Bottom of Onondaga Lake? • Pere Lemoyne’s hat • win a UFI t-shirt • text your answers to 22422
So … What’s in the Bottom of Onondaga Lake? • Pere Lemoyne’s hat • A Cornell coxswain
So … What’s in the Bottom of Onondaga Lake? • Pere Lemoyne’s hat • A Cornell coxswain • Ben Schwartzwalder’s comb
So … What’s in the Bottom of Onondaga Lake? • Pere Lemoyne’s hat • A Cornell coxswain • Ben Schwartzwalder’s comb • The veil of Onondaga
So … What’s in the Bottom of Onondaga Lake? • Pere Lemoyne’s hat • A Cornell coxswain • Ben Schwartzwalder’s comb • The veil of Onondaga • Le Soup d’Yesterjour SOD MeHg NH3 SND PO4 H2S CH4
The Path to Recovery Runs Through the Soup … with organic carbon fueling the fire. Le Soup d’Yesterjour … when and to what extent?
Diagenesis and the Slow Eigenvalue in Onondaga Lake burial; Hg slow eigenvalue diagenesis; NH3, P P, NH3, Hg
They weren’t supposed to do this until I was dead. Chapra (2009) The Slow Eigenvalue in Onondaga Lake P slow eigenvalue P (mgP∙m-2∙d-1)
The Slow Eigenvalue in Onondaga Lake 0.0 0.2 0.4 0.6 0.8 1.0 0 NH3 Total Nitrogen (%DW) 10 20 slow eigenvalue 30 NH3-N (mg∙m-2∙d-1) Depth in Sediment (cm) 40 50
The Slow Eigenvalue in Onondaga Lake Hg, MeHg Total Mercury (µg∙gDW-1) MeHg HAR (ng∙m-2∙d-1) Depth in Sediment (cm) slow eigenvalue 1997 Total Hg
Carbon Diagenesis and Water Quality external management variable The Fuel loads The Gatekeepers O2 NO3 PNH3H2S MeHgCH4 The Engine
Carbon Diagenesis and Water Quality external management variable The Fuel loads internal loads P NH3H2S MeHgCH4 The Engine
Organic Carbon Diagenesis in Sediments: The Slow Eigenvalue diagenesis slow eigenvalue operative processes burial C P NH3H2S MeHgCH4
Quantifying Legacy Carbon DIAGENESIS with constant deposition Total Organic Carbon (%DW) Depth in Sediment (cm)
Quantifying Legacy Carbon DIAGENESIS with variable deposition Total Organic Carbon (%DW) Depth in Sediment (cm)
Quantifying Legacy Carbon LABILITY ASSAYS under oxic conditions Z = 2.0-2.5 cm Z = 58-60 cm Oxygen Consumed (mgO2∙gDW-1) by oxidative metabolism Incubation Time (d)
Quantifying Legacy Carbon LABILITY ASSAYS under anoxic conditions by fermentativemetabolism Oxygen Consumed (mgO2∙gDW-1) Z = 21 cm Z = 49 cm Incubation Time (d)
Quantifying Legacy Carbon LABILITY AT DEPOSITION by fermentative metabolism 56% by oxidative metabolism 90%
Quantifying Legacy Carbon EXPECTATIONS for downcore changes in lability Total Organic Carbon (%DW) Depth in Sediment (cm)
Quantifying Legacy Carbon LABILITY PROFILE under oxic conditions Total Organic Carbon (%DW) Labile Organic Carbon (%TOC) No Redemption Depth in Sediment (cm) Depth in Sediment (cm) oxidative metabolism
Quantifying Legacy Carbon LABILITY PROFILE under anoxic conditions Total Organic Carbon (%DW) Labile Organic Carbon (%TOC No Redemption Depth in Sediment (cm) Depth in Sediment (cm) fermentative metabolism
Quantifying Legacy Carbon MAPPING DIAGENESIS electron acceptor electron donor reduced species end product + CO2 + various various
Quantifying Legacy Carbon • MAPPING DIAGENESIS • ETSA and the localization of oxidative processes region of oxidative metabolism ~0-10 cm
Quantifying Legacy Carbon • MAPPING DIAGENESIS • localization of methanogenesis region of fermentative metabolism ~10-20 cm Depth in Sediment (cm)
Quantifying Legacy Carbon Total Organic Carbon (%DW) • LITANY OF LEGACY • 14 years in the mud om Depth in Sediment (cm) rm
Ötzi the Iceman Preservation (think iceman) MECHANISMS • surface adsorption on mineral particles • encapsulation in the mineral microfabric • biological protection (necromass) • humification (enzyme resistance) Thompsen et al. 2002; Arnarson and Keil 2007; Curry et al. 2007 Mayer et al. 1994a,b, 2004; Zimmerman et al. 2004; Curry et al. 2007 b. 3300 BCE Ladd and Paul 1973; Mayer 2004 Hedges 1988; Hedges et al. 1999; Hedges and Keil 1995
Does this mean … ? Total Organic Carbon (%DW) om Depth in Sediment (cm) rm preservation
Ah … yes … redemption! Total Organic Carbon (%DW) Depth in Sediment (cm)
SINS OF THE MOTHERS AND FATHERS: WHITHER REDEMPTION?
Carbon Diagenesis and Water Quality The Model external management variable The Fuel • THE • load driven • water column linked • coupled • flux predicting • MODEL loads The Gatekeepers O2 NO3 PNH3H2S MeHgCH4 The Engine