Download
1 / 38
431 likes | 574 Views
CHAPTER 2: ENERGY BANDS & CARRIER CONCENTRATION IN THERMAL EQUILIBRIUM. 2.1.1 SEMICONDUCTOR MATERIALS. The goal is: To understand the characteristic of semiconductor materials – you need PHYSICS. Basic Solid-State Physics – materials, may be grouped into 3 main classes:

E N D
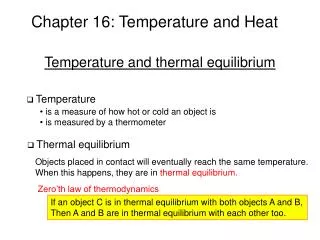
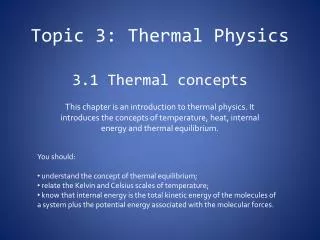
CHAPTER 2: ENERGY BANDS & CARRIER CONCENTRATION IN THERMAL EQUILIBRIUM
2.1.1 SEMICONDUCTOR MATERIALS The goal is: • To understand the characteristic of semiconductor materials – you need PHYSICS. • Basic Solid-State Physics – materials, may be grouped into 3 main classes: (i) Insulators, (ii) Semiconductors, and (iii) Conductors • Electrical conductivity : =1/.
Figure 2.1. Typical range of conductivities for insulators, semiconductors, and conductors.
SEMICONDUCTOR’S ELEMENTS • The study of semiconductor materials since 19th century. • Early 1950s – Ge was the major semiconductor material, and later in early 1960s, Si has become a practical substitute with several advantages: (i) better properties at room temperature, (ii) can be grown thermally – high quality silicon oxide, (iii) Lower cost, and (iv) Easy to get, silica & silicates comprises 25% of the Earth’s crust.
COMPOUND SEMICONDUCTORS • Types of compounds: (i) binary compounds - combination of two elements. - i.e GaAs is a III – IV. (ii) ternary and quaternary compounds - for special applications purposes. - ternary compounds, i.e alloy semiconductor AlxGa1-xAs (III – IV). - quaternary compounds with the form of AxB1-xCyD1-y , so-called combination of many binary & ternary compounds. - more complex processes. • GaAs – high speed electronic & photonic applications
2.1.2 BASIC CRYSTAL STRUCTURE • Lattice – the periodic arrangement of atoms in a crystal. • Unit Cell – represent the entire lattice (by repeating unit cell throughout the crystal) The Unit Cell • 3-D unit cell shown in Fig. 2.2. • Relationship between this cell & the lattice – three vectors: a, b, and c (not be perpendicular to each other, not be equal in length). • Equivalent lattice point in 3-D: • m, n, and p - integers. Fig. 2.2. A generalized primitive unit cell. (1)
Figure 2.3. Three cubic-crystal unit cells. (a) Simple cubic. (b) Body-centered cubic. (c) Face-centered cubic. UNIT CELL Large number of elements • simple cubic (sc) – atom at each corner of the cubic lattice, each atoms • has 6 equidistant nearest-neighbor atoms. • body-centered cubic (bcc) – 8 corner atoms, an atom is located at center • of the cube. • - each atom has 8 nearest-neighbor atoms. • face-centered cubic (fcc) – 1 atom at each of the 6 cubic faces in addition • to the 8 corner atoms. 12 nearest-neighbor atoms.
Fig. 2.4. (a) Diamond lattice. (b) Zinc-blende lattice. THE DIAMOND STRUCTURE • Si and Ge have a diamond lattice structure shown in Fig. 2.4. • Fig. 2.4(a) – a corner atom has 1 nearest neighbor in the body diagonal direction, no neighbor in the reverse direction. • Most of III-IV compound semiconductor (e.g GaAs) have zinc-blende structure. a/2 a/2
Figure 2.6. Miller indices of some important planes in a cubic crystal. CRYSTAL PLANES & MILLER INDICES • Crystal properties along different planes are different – electrical & other devices characteristics can be dependent on the crystal orientation – use Miller indices. • Miller indices are obtained using the following steps: • (i) find the interfaces of the plane on the 3 Cartesian coordinates in term of the lattice constant. • (ii) Take the reciprocal of these numbers and reduce them to smallest 3 integers having the same ratio. • (iii) Enclose the result in parentheses (hkl) as the Miller indices for a single plane.
BASIC CRYSTAL GROWTH TECHNIQUE Prof. J. Czochralski, 1885-1953 • 95% electronic industry used Si. • Steps from SiO2 or quartzite. • Most common method called Czochralski • technique (CZ). • Melting point of Si = 1412ºC. • Choose the suitable orientation <111> • for seed crystal. Figure 2.8.Simplified schematic drawing of the Czochralski puller. Clockwise (CW), counterclockwise (CCW). Si ingot
Figure 2.11. (a) A tetrahedron bond. (b) Schematic two-dimensional representation of a tetrahedron bond. VALENCE BONDS • Fig. 2.11(a) – each atom has 4 ē in • the outer orbit, and share these • valence ē with 4 neighbors. • Sharing of ē called covalent bonding – • occurred between atoms of same and • different elements respectively. • Example: • GaAs – small ionic contribution that is • an electrostatic interactive forces between • each Ga+ ions and its 4 neighboring As- ions • means that the ē bondingspend more • time in the As atom than in the Ga atom. Figure 2.12. The basic bond representation of intrinsic silicon. (a) A broken bond at Position A, resulting in a conduction electron and a hole. (b) A broken bond at position B.
ENERGY BANDS Neils Bohr, 1885-1962 Nobel Prize in physics 1922 • Energy levels for an isolated hydrogen atom are given by the Bohr model: (2) mo – free electron mass (0.91094 x 10⁻³⁰kg) q – electronic charges: 1.6 x 10⁻¹⁹ C 0 – free space permittivity (8.85418 x 10⁻¹² F/m) h – Planck constant (6.62607 x 10⁻³⁴ J.s) n – positive integer called principle quantum number 1 eV = 1.6 x 10⁻¹⁹ J • For 1st energy state or ground state energy level, n = 1, EH = -13.6eV. • For the 1st excited energy level, n = 2. • For higher principle quantum number (n ≥ 2), energy levels are split.
ENERGY BANDS (cont.) For two identical atoms: • When they far apart – have same energy. • When they are brought closer: – split into two energy levels by interaction between the atoms. - as N isolated atoms to form a solid. - the orbit of each outer electrons of different atoms overlap & interact with each other. - these interactions cause a shift in the energy levels (case of two interacting atoms). - when N>>>, an essentially continuous band of energy. This band of N level may extend over a few eV depending on the inter-atomic spacing of the crystal.
Figure 2.13. The splitting of a degenerate state into a band of allowed energies. ENERGY BANDS (cont.) Equilibrium inter-atomic distance of the crystal. Figure 2.14. Schematic presentation of an isolated silicon atom.
ENERGY BANDS (cont.) • At T = 0K, electrons occupy the lowest energy states: Thus, all states in the valence band (lower band) will be full, and all states in the cond. band (upper band) will be empty. • The bottom of conduction band is called EC, and the top of valence band called EV. • Band gap energy Eg = (EC– EV). • Physically, Eg defined as ‘the energy required to break a bond in the semiconductor to free an electron to the conduction band and leave the hole in the valence band’. (Please remember this important definition).
Figure 2.16. The parabolic energy (E) vs. momentum (p) curve for a free electron. The Energy-Momentum Diagram • The energy of free-electron is given by (3) p – momentum, m0 – free-electron mass • effective mass = mn (4) • for the narrower parabola (correspond • to the larger 2nd derivative) – smaller mn • for holes, mn = mp
Figure 2.17.A schematic energy-momentum diagram for a special semiconductor with mn = 0.25m0 and mp = m0. The Energy-Momentum Diagram • Fig. 2.17 at the RHS shows the simplified energy-momentum of a special semiconductor with: • - electron effective mass mn = 0.25m0 in cond. band. • - hole effective mass mp = m0 in the valence band. • electron energy is measured upward • hole energy is measured downward • the spacing between p = 0 and minimum of upper parabola is called band gap Eg. • For the actual case, • i.e Si and GaAs – more complex.
Figure 2.18. Energy band structures of Si and GaAs. Circles (º) indicate holes in the valence bands and dots (•) indicate electrons in the conduction bands. GaAs Si • Fig. 2.18 is similar to Fig. 2.17. • For Si, max in the valence band • occurs at p = 0, but min of cond. • band occurs at p = pc (along [100] • direction). • In Si, when electron makes • transition from max point (valence • band) to min point (cond. band) it • required: • Energy change (≥Eg) + momentum • change (≥pc). • In GaAs: without a change in • momentum. • Si – indirect semiconductor. • GaAs – direct semiconductor. Band gap
CONDUCTION Metals/Conductors • Very low resistivity. • Conduction band either is partially filled (i.e Cu) or overlaps in valence band (i.e Zn, Pb). • No band gap. Electron are free to move with only a small applied field. Current conduction can readily occur in conductors. Insulators • Valence electrons form strong bonds between neighboring atoms (i.e SiO2). • No free electrons to participate in current conduction near room temperature. • Large band gap. Electrical conductivity very small – very high resistivity. Semiconductors • Much smaller band gap ~ 1eV. • At T=0K, no electrons in conduction band. Poor conductors at low temperatures. • Eg = 1.12eV (Si) and Eg=1.42eV (GaAs) – at room temp. & normal atmosphere.
Figure 2.19. Schematic energy band representations of (a) a conductor with two possibilities (either the partially filled conduction band shown at the upper portion or the overlapping bands shown at the lower portion), (b) a semiconductor, and (c) an insulator. (b) (b) (c) (a)
2.2 INTRINSIC CARRIER CONCENTRATION • In thermal equilibrium: - at steady-state condition (at given temp. without any external energy, i.e light, pressure or electric field). • Intrinsic semiconductor – contains relatively small amounts of impurities compared with thermally generated electrons and holes. • Electron density, n – number electrons per unit volume. • To obtain electron density in intrinsic s/c – evaluate the electron density in an incremental energy range dE. • Thus, n is given by integrating density of state, N(E), energy range, F(E), and incremental energy range, dE, from bottom of the cond. band, EC = E = 0 to the top of the cond. band Etop.
Figure 2.20. Fermi distribution function F(E) versus (E – EF) for various temperatures. • We may write n as (5) • Fermi-Dirac distribution function (probability that ē occupies an electronic state with energy E) (6) n is in cm-3, and N(E) is in (cm3 .eV)-1 k Boltzmann constant ~ 1.38066 x 10⁻²³ J/K, and Tin Kelvin. EF – energy of Fermi level (is the energy at which the probability of occupation by electron is exactly one-half)
Paul Adrien Maurice Dirac (1902 – 1984) Nobel Prize in Physics 1933 Enrico Fermi (1901 – 1954) Nobel Prize in Physics 1938 “There are two possible outcomes: If the result confirms the hypothesis, then you've made a measurement. If the result is contrary to the hypothesis, then you've made a discovery” “Mathematics is the tool specially suited for dealing with abstract concepts of any kind and there is no limit to its power in this field”
For energy, 3KT above or below Fermi energy, then (7) (8) • > 3KT the exponential term larger than 20, and < 3kT – smaller than 0.05. • At (E – EF) < 3KT – the probability that a hole occupies a state located at energy E.
Figure 2.21. Intrinsic semiconductor. (a) Schematic band diagram. (b) Density of states. (c) Fermi distribution function. (d) Carrier concentration. • N(E) = (E)1/2 for a given electron effective mass. • EF located at the middle of band gap. • Upper-shaded in (d) corresponds to the electron density.
(9) h – Planck constant ~ 6.62607 x 10⁻³⁴ J.s • Density of state, N(E) is defined as • substituting (9) and (8) into (5), thus (10) • NC and NV effective density of state in conduction band & valence band respectively. • At room temperature, T = 300K;
Figure 2.22.Intrinsic carrier densities in Si and GaAs as a function of the reciprocal of temperature. • Intrinsic carrier density is obtained by: (mass action law) (11) Where Eg = EC - EV
2.3 DONORS & ACCEPTORS • When semiconductor is doped with impurities – become extrinsic and impurity energy levels are introduced. • Donor : n-type • Acceptor : p-type • Ionization energy: (12) • 0– permittivity in vacuum ~ 8.85418 x 10⁻¹⁴ F/cm • S– semiconductor permittivity, and EH ~ Bohr’s energy model
Figure 2.23. Schematic bond pictures for (a) n-type Si with donor (arsenic) and (b) p-type Si with acceptor (boron).
NON-DEGENERATE SEMICONDUCTOR • In previous section, we assumed that Fermi level EF is at least 3KT above EV and 3KT below EC. Such semiconductor called non-degenerate s/c. • Complete ionization – conduction at shallow donors in Si and GaAs where they have enough thermal energy to supply ED to ionize all donor impurities at room temperature, thus provide the same number of electrons in the conduction band. • Under complete ionization conduction, electron density may be written as n = ND (13) And for shallow acceptors; p = NA (14) Where ND and NA– donor and acceptor concentration respectively. • From electron and hole density (10) and (13) & (14), thus (15) (15) * Higher donor/acceptor concentration – smaller ∆E.
Figure 2.25. Schematic energy band representation of extrinsic semiconductors with (a) donor ions and (b) acceptor ions. Non-degenerate Semiconductor
Figure 2.26. n-Type semiconductor. (a) Schematic band diagram. (b) Density of states. (c) Fermi distribution function (d) Carrier concentration. Note that np = ni2. NON-DEGENERATE SEMICONDUCTOR (cont.) Much closer to conduction band *** p-type semiconductor???
NON-DEGENERATE SEMICONDUCTOR (cont.) • To express electron & hole densities in term of intrinsic part (concentration and Fermi level) – used as a reference level when discussing extrinsic s/c, thus; (16) • In extrinsic s/c, Fermi level moves towards either bottom of conduction band • (n-type) or top of valence band (p-type). It depends on the domination of • types carriers. • Product of the two types of carriers will remains constant at a given temp.
NON-DEGENERATE SEMICONDUCTOR (cont.) • The impurity that is present in greater concentration, thus it may determines • the type of conductivity in the s/c. • Under complete ionization: (17) Solve (17) with mass action law, thus (18) (19) Subscript of n and p refer to n and p-type.
EXAMPLE Find the energy relationship for a free electron to the electron mass. Bonus for each student solve this example till 22nd of July 2009
DEGENERATE SEMICONDUCTOR • For a very heavy doped n-type and p-type s/c, EF will be above ECor below EV– this refereed to “degenerate semiconductor”. • Approximation of (7) and (8) are no longer use. Electron density (5) may solved numerically. • Important aspect of high doping ~ band gap narrowing effect (reduced the band gap), and it given by (at T=300K); (20)
CONCLUSION REMARKS • The properties of s/c are determined to a large extend by the crystal structure. • Miller indices are to describe the crystal surfaces & crystal orientation. • The bonding of atoms & electron energy-momentum relationship – connection to the electrical properties of semiconductor. • Energy band diagram is very important to understand using physics approach why some materials are good and some are poor in term of conductor of electric current. • Some external/internal changing of s/c (temperature and impurities) may drastically vary the conductivity of s/c. • The understanding of physics behind the semiconductor behaviours is very important for Microelectronic Engineer to handle the problems as well as to produced a high-speed devices performance.
Motivation “I was born not knowing and have had only a little time to change that here and there” Richard P. Feynman (1918-1988) Nobel Prize in Physics 1965