Download
1 / 10
100 likes | 313 Views
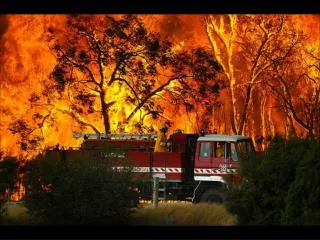
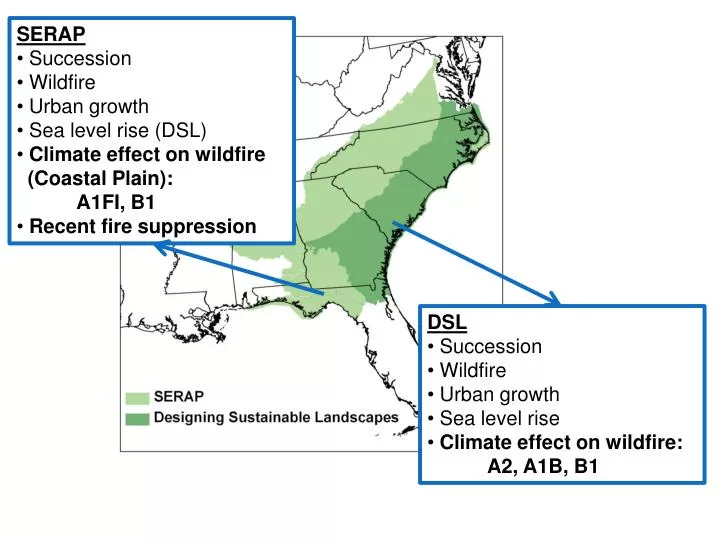
SERAP Succession Wildfire Urban growth Sea level rise (DSL) Climate effect on wildfire (Coastal Plain): A1FI, B1 Recent fire suppression. DSL Succession Wildfire Urban growth Sea level rise Climate effect on wildfire: A2, A1B, B1.

E N D
SERAP • Succession • Wildfire • Urban growth • Sea level rise (DSL) • Climate effect on wildfire (Coastal Plain): • A1FI, B1 • Recent fire suppression • DSL • Succession • Wildfire • Urban growth • Sea level rise • Climate effect on wildfire: • A2, A1B, B1
Output data characteristics • Decadal data layers through 2100 • Polygons (average size ~10 hectares), converted to 30 m raster • Each polygon labeled with land cover type, successional stage and structure • Available from NCSU Biodiversity and Spatial Information Center • DSL: http://www.basic.ncsu.edu/dsl/downloads.html • SERAP: Coming Soon!Contact jennifer_costanza@ncsu.edu
Landscape ChangeCharleston, SC Lake Moultrie 2001 +10 years +20 years +30 years +40 years +50 years Incorporates:disturbance,succession urban growth (SLEUTH), sea level rise (SLAMM) +60 years +70 years +80 years Charleston +90 years +100 years
Using the data • Land cover types represent mapped polygon characteristics • Distributions of age and canopy structure across region match FIA data • Best for summaries across regions or groups of counties Example: Projected longleaf pine composition - 2100
Caveats of modeling approach • Model states are defined ahead of time, no surprises in characteristics of states, just their composition across landscape • In vegetation dynamics models, effects of climate change are indirect: • Changes to wildfire regime • Define a new vegetation state based on info from other models or data • Locations of vegetation polygons static through time
Strengths of data and approach • Integrates urban growth, sea level rise, vegetation dynamics • Explore and compare alternative scenarios of landscape change • Summarize changes across regions • Use as a communication tool to visualize results • Vegetation dynamics models used by DoD (Eglin AFB) and VA Tech, US Forest Service, TNC • Good base layer, many more scenarios possible!
SALCC Introduction Next steps and how the SALCC will use this product
Questions/Comments Questions or comments from presentation about Jen’s presentation? Questions or comments in general about the SALCC, what we’re doing, where we’re going, etc.?
Next SALCC Third Thursday Web Forum • Thursday, November 15 – 10:00am EST • Landscape Conservation Cooperatives and Climate Science Centers: An Evolving Relationship • Jerry McMahon (Southeast Climate Science Center) & Rua Mordecai (South Atlantic LCC)
Contacts Ken McDermond – ken_mcdermond@fws.gov Rua Mordecai – rua@southatlanticlcc.org Janet Cakir – janet_cakir@nps.gov Amy Keister – amy_keister@fws.gov Laurie Rounds – laurie.rounds@noaa.gov Ginger Deason – ginger@southatlanticlcc.org Jen Costanza –jkcostan@ncsu.edu