Download
1 / 37
370 likes | 470 Views
PSY4320 Research methods in cognitive neuroscience. Preliminary results Lars T. Westlye, PhD Research Fellow Center for the Study of Human Cognition Department of Psychology, University of Oslo l.t.westlye@psykologi.uio.no. Hypotheses.

E N D
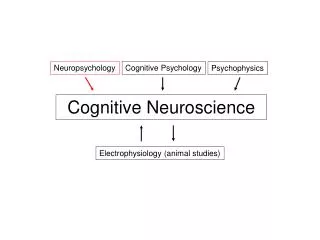
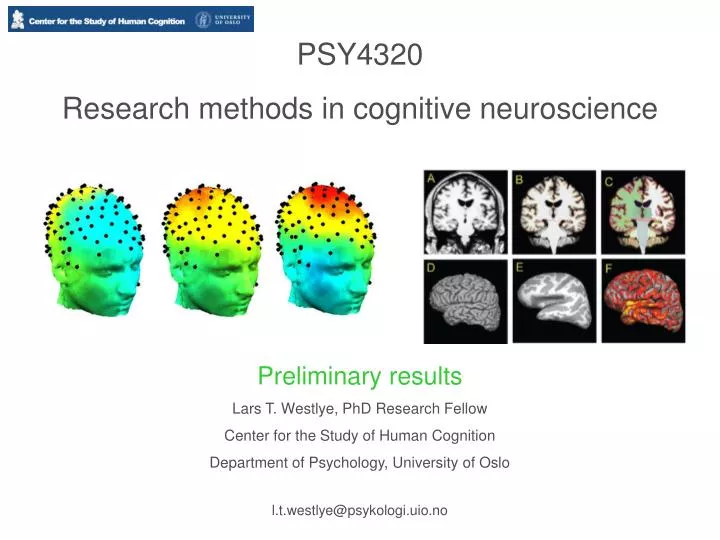
PSY4320 Research methods in cognitive neuroscience Preliminary results Lars T. Westlye, PhD Research Fellow Center for the Study of Human Cognition Department of Psychology, University of Oslo l.t.westlye@psykologi.uio.no
Hypotheses • Decreased P3a amplitude in the old compared to the young group • Decreased cortical thickness and FA in the old compared to the young group • Cortical thickness and FA positively correlated with amplitude in both groups • Spatial distribution and strenght of the relationships between vary between groups
Channel posititions F = frontal Cz P = parietal O = occipital Z = central
P3a amplitude old P3a young
P3a amplitude Independent samples t-test Amplitude significantly stronger in the young than the old group
P3a amplitude Spatiotemporal distribution of the differences between young and old group (p3a) Increased frontal activation in old compared to young group FRONTAL SHIFT?
Young vs old Female 25 years Female 74 years
Cortical thickness Old Young General Linear Model testing the effect of group Mean young group Thickness (vertexn) = (young × β1) + (old × β2) + error Mean old group H0: β1 = β2 (no difference between group)
Old Young General Linear Model testing the effect of group Young > Old Colored areas: p(β1= β2)< 5% (here we reject H0)
FA Red areas: reduced FA in old compared to young group
FA ~ 60 % of the skeleton voxels show a significant effect of group (young > old)
FA Independent samples t-test ~ 60 % of the skeleton voxels show a significant effect of group (young > old)
O Y NB! Life-span changes in FA are not linear FA increases until ~30 years
Cortical thickness vs P3a amplitude General Linear Model testing the effect of P3a amplitude on thickness within and between groups Thickness (vertexn) = (young×β1) + (old×β2) + (ERPy× β3) + (ERPo × β4) + error Within groups: H01: β3 = 0 (no relation between amplitude and thickness in young group ) H02: β4 = 0 (no relation between amplitude and thickness in old group ) Between groups H03: β3 = β4 (no difference between β3 and β4)
Cortical thickness vs P3a amplitude Young Colored areas: the probability (p) of H0 < 5 % H0: β3 = 0 (no relation between amplitude and thickness in young group )
Cortical thickness vs P3a amplitude Old Colored areas: the probability (p) of H0 < 5 % H0: β4 = 0 (no relation between amplitude and thickness in old group )
p(β3)=0 p(β4)=0 Within groups young old Between groups H03: β3 = β4 (no difference between the amplitude × thickness correlations between groups)
p(β3 = β4) < 5% Red areas: thickness stronger related to amplitude in young than in old group
p(β3)=0 p(β3 = β4) < 5% p(β4)=0 Red areas: thickness stronger related to amplitude in young than in old group
FA vs P3a amplitude in young group Green areas: negative correlation between amplitude and FA
FA vs P3a amplitude in young group β= -.67, p < .01
FA vs P3a amplitude in old group Red areas: negative correlation between amplitude and FA
FA vs P3a amplitude in old group β= -.71 p < .01
How do we explain the negative correlations between amplitude and FA? Tract 1 High FA Low FA Tract 2 High FA Crossing fibres?
How do we explain the negative correlations between amplitude and FA? Radial diffusion Radial diffusion Increased radial diffusion?
How do we explain the negative correlations between amplitude and FA? Perpendicular Along Radial diffusion Radial diffusion Positive correlation between radial diffusion and P3a amplitude Increased axonal calibre/diameter?
Summary FA/thickness: Young > old P3a positively correlated with thickness Young Old Young vs old P3a negatively correlated with FA P3a positively correlated with radial diffusion Young Old
The inverse problem Scalp electrodes Scalp EEG Theoretical source 1 Theoretical source 2 Question: How do you separate signals from the various sources?
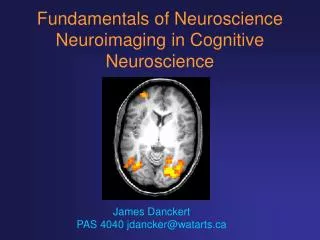
Research questions Task #2 Correlate MRI brain structural measures (cortical thickness, diffusion tensor imaging) with ERP parameters between and across groups A) How do the different measures change with age? B) Are the relationships between MRI and ERP different between groups?
Young vs old Female 25 years Female 74 years
Does the same pattern emerge when comparing groups of subjects? -- Young participants -- Old participants
Course research assignments Task #1 Compare peak amplitude and latency between two groups: Group A: young (n=30, 20-25 years) Group B: old (n=30, 70-75 years)