Download
1 / 66
660 likes | 796 Views
Civilizations as Dynamic Networks Douglas R. White, February 2005 Sunbelt XXV Redondo Beach. Background paper Civilizations as Dynamic Networks: Medieval to Modern , a project with Peter Spufford, assisted by Joseph Wehbe. Outline. Background of medieval Europe

E N D
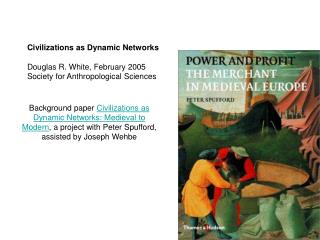
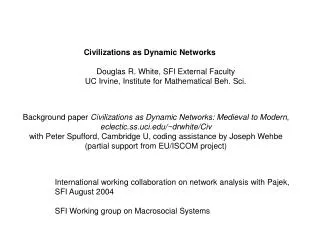
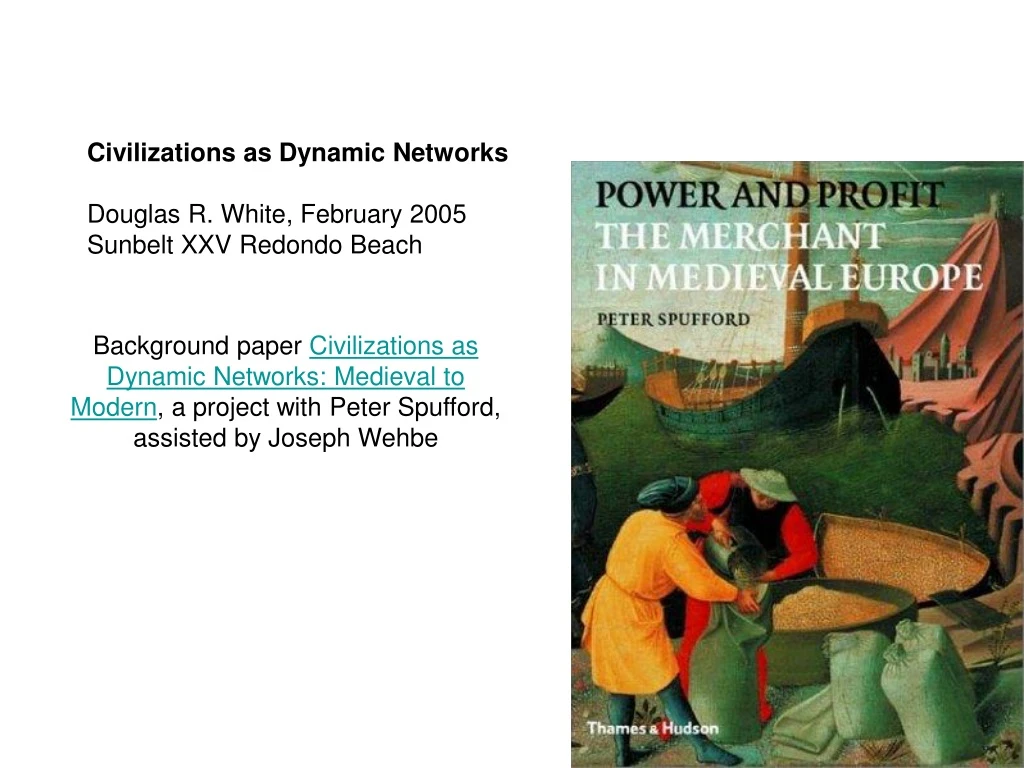
Civilizations as Dynamic Networks Douglas R. White, February 2005 Sunbelt XXV Redondo Beach Background paper Civilizations as Dynamic Networks: Medieval to Modern, a project with Peter Spufford, assisted by Joseph Wehbe
Outline • Background of medieval Europe • Dynamics from initial conditions of European feudalism to evolving cities and urban trade network • Network properties affecting network processes in evolution of cities • Processes affecting evolving urban industries • Factors in system decline and resurgence
Silk, Jade and Porcelain from China - Spice trade from India and SE Asia - Gold and Salt from Africa In the 14th C, economic depression set in, inflation abates and population drops, with famines beginning well before the Black Death. With the closure of the Mongol Corridor (Golden Horde) in the 1360s, the European trade network crashed. The lead-up to the 13th C world-system and its economy was a period of population pressure and crisis as environmental carrying capacities were reached. In spite of new systems of accounting and indirect taxation in which monarchies benefited from trade, monarchs continued to print money and demand loans from wealthy merchants, contributing to inflation. What Came Before? What was the world-system like at the end of the pre-classical period in 500BC? Population growth and inflation begin again in the 16th century and revived into the modern world economy.
These trade routes mostly form a tree, with a narrow cohesive core from India to Gibraltar Trade networks before 500BC were smaller, even more tree-like, and lacking cohesion
During the classical period trade routes become cohesive from China to France
(figures courtesy of Andrew Sherratt, ArchAtlas) Cohesive extension of trade routes leads to a host of other developments…
… including power-law growth of world population. • Before we go there, it helps to know that all power-law growth entails strong predictions from its singularity date (in this case 2030 ± 10) as the outer limit of sustained growth: • It necessitates a transition before singularity • (2) It predicts cycles of diminishing length as singularity approaches In millions, actual and trend And if we take the departure from the trend to define cycles of change we can begin to study other changes …
Detrended as a percentage of prior population …we see cycles of population growth Source: White et al. Detrended World Population to 1800, in millions
Detrended Populations: World (logged) and England Source: White et al. Cycles grow shorter as predicted by power-law growth. England’s population cycles lag the World cycles, which are heavily weighted by China and India
In Europe, population cycles are part of a dynamic that drives monetization in the 12th-14th centuries. Here is Peter Turchin's Nonlinear Time Series Analyzer for the detrended English population cycle, 1100-1800, with cycles growing shorter in 300-200 year periods. The cycles and their correlates, such as competition, wages and inflation are not purely endogenous, however. English Population peaks at 1310, 1650 (15,49); troughs at 1450, 1770 (29,62), 0=1160 Cycles grow shorter as predicted by power-law growth. Source: Turchin
Correlates that do not interact dynamically include: EnglishInflation cycles (David Hackett Fischer) imitate Detrended EnglishPopulation cycles (Turchin) Renaissance Equilibrium (begins with economic depression) 1900
Arrighi's thesis of an alternation of commodity and financial capital intensity also fits into the periodization of the pop-war interactive cycles and the inflationary price cycles The inflation of land was far worse in rural areas: The less commercial, the more inflation (Spufford)
English sociopolitical violencecycles don’t directly correlate but lagpopulation cycles. Detrended English population cycles, 1100-1900, occur every 300-200 years. Source: Turchin
Effects of Inflation of Land on Monetization The population and sociopolitical crisisdynamic that drove Inflation also drove monetization and trade in luxury goods in the 12th-15th centuries. Inflation of land valuecreatedmigration of impoverished peasantsejected from the land, demands of money rents for parts of rural estates, and substitution of salaries for payments in land to retainers,
A cycle, however, does not make an interactive dynamic, which is a pair of variables that drive one another interactively, with lagged effects, rather than each operating under its own inertia. This slide shows an idealized phase diagram for a pair of interactive variables, which might be population sizes of foxes and hares, or population size of agrarian regimes with limited carrying capacity interacting with magnitude of sociopolitical violence that occurs as populations reach this carrying capacity and then recede – and the population crisis leads to a collapse, followed by a new cycle. Where you are on this phase diagram predicts where you are going; this is not true for correlated variables Source: Turchin This is also where environment comes into the dynamics
This is Turchin's phase diagram for England, 1480-1800, for population size and sociopolitical violence as a pair of variables that drive one another interactively. Temporal movement here is clockwise (axes are reversed from the previous diagram). The dynamic is that the population reaches carrying capacity setting sociopolitical violence into play, which only recedes as population crisis leads to a collapse, leading into a new cycle. Where you are on this phase diagram predicts where you are going; this is not true for correlated variables
Turchin tests statistically the interactive prediction versus the inertial prediction for England
the freedom for newly monetized nobility to move to cities, the rise of elite competition and conspicuous consumption in the cities; and, in the French dominions, resettlement of nobility the largest city of times, and the most influential political capital, Paris (year 1400, after the pre-renaissance inflation and just before the collapse of Paris due to competing factions) Source: Spufford
Inflationary cycles 1200-1993 England (steeper in rural areas; flatter in major trading cities) Source: David Hackett Fischer
Environmental limits interact with population and sociopolitical violence In periods of crisis, further monetization (which proceeds today) drives Volume of trade (velocity of money). This will transform those organizations and institutions situated at predictable network junctures Each cycle leaves institutions, transportation, technology transformed and the next cycle builds upon these so there are millennial trends and increasing environmental capacity that also predict network-situated innovation This happens in China and in India as well as Europe
Position in networks deflects how the cyclical dynamics affect individual citiesfor example, (net 1) in the cohesive core of a trade network all cities may benefit; outliers less so as they suffer from middleman monopolies
(Net 1) Cohesive trade relations (gold nodes) supported the creation of wealth among merchants and merchant cities, with states supported by indirect taxation and loans. [ Northern Europe is not well represented in Spufford's study (and these locations are not geographic), but the main Hanseatic League port of Lubeck had about 1/6th the trade of Genoa, 1/5th that of Venice. ]
Cohesive nodes (gold and red) in an expanded exchange network and further road identification (red=3-cohesive) shows a second cohesive accumulation center further to the east -- again, such cohesion supported the creation of wealth among merchants and merchant cities, with states supported by indirect taxation and loans. Red 3-components Middle East and its 3-core not sampled Now Northern Europe is represented (and the locations are geographic): the main Hanseatic League port of Lubeck had about 1/6th the trade of Genoa, 1/5th that of Venice.
Nodes for cities are sized here according to population; middle and larger sizes are also capital cities. Monetization and growth in the volume of trade. In Europe of the 13th century, described in Spufford's (2002) Power and Profit: The Merchant in Medieval Europe, capital cities first sprang into prominence with a remarkable growth in urbanization, monetization and government. With France as the leading landed kingdom, Paris was the leader in population, attraction and influence. Lets look at an example of trade: raw material (wool), shipping (from ports), and manufacture (woolens as clothing) (Net 2) The netflowthesis: organizational transformations occurring in this period, which set the foundations for modern Europe, were driven by the cyclical dynamic of interaction between demography and sociopolitical violence affecting monetization, velocity of trade.
Nodes for cities are sized here according to population; middle and larger sizes are also capital cities. Raw wool production sites GIS mappings of sources of raw wool (sheep) in Spufford's European trade network will begin to illustrate geographical distribution of trade potentials. Source: Peter Spufford 2002 data transported to GIS
Nodes for cities are sized here according to population; middle and larger sizes are also capital cities. Manufacture of woolens to make wool cloth, clothing (Source: Spufford's 2002 European trade network data transported to GIS )
Nodes for cities are sized here according to population; middle and larger sizes are also capital cities. Seaports with wool exports or manufacture of woolens (Source: Spufford's 2002 European trade network data transported to GIS ) As an example of (net 2) netflow transformation in agent space, agents from lowland countries in north Europe organized wool trade contracts out of London, but in the 1200s Florentine and other agents with cheaper sources of credit took over the trade from London, displacing the Flemings.
Competition over the Wool / Woolens trade (12th C map) Node sizes:
Because sea routes opened cohesive exchange cycles as alternatives to land routes, a positional similarityanalysis reflects a cohesive and non-monopolistic trade network The importance of land versus sea routes oscillated during the 12th-15th centuries.. The split in Genoese (western and Atlantic) and Venetian (eastern) routes is also reflected in the circular positional structure, showing how they compete for trade. Genoa dominates the core cities at the lower right, but their cluster and that of more peripheral cities at the upper left each has its banking cities. Venice is more a single eastern bridge between land and E. Mediterranean. Venice Regular equivalence analysis with normalized SVD scaling based on valued {1,2,3,4} ties = {Aux,Prin} banking {Ven,Gen} Ports Now for a detailed look at how population cycles and trade networks promote industries Genoa
(database now expanded to 299 cities) (Net3) Productivities are overlapping, crosscutting and interlaced in complex ways
(Net3) Productivities are overlapping, crosscutting and interlaced in complex ways Note how an industrial "blue banana" construction is taking place with communications in the left column, art works in the middle and linens on the left, i.e., circulation among the NW-SE poles; while capitals show a political vacuum of smaller polities in between, and trade fairs fill in this vacuum by providing decentralized marketing institutions.
(Net3) Productivities are overlapping, crosscutting and interlaced in complex ways
(Net 4) Monetization entails a counterflow of commodities and credit that facilitates trade. Credit networks (e.g., banking) are also a means of distributed control. banking network key: (roughly geographical)
the banking network, main routes only (again, geographically). (Net 5) Control networks often rely on unambiguous centralized spines but their operation relies on feedback in cohesive networks. the spine of the exchange system is tree-like and thus centralized. It is land based. Linking the four parts was Alessandria, a small stronghold fortification built in 1164-1167 by the Lombard League and named for Pope Alexander III. At first a free commune, the city passed in 1348 to the duchy of Milan. Note again the closeness of Genoa to the center, and the exclusion of Venice.
main routes in the banking network, plus maritime (Genoa and Venice). Now we see how Venice is encapsulated in its own eastern subnetwork. competing with Milan and Genoa
Betweenness Centralities in the banking network (Net 6) Betweenness centrality in the trade network ought to predict accumulation of mercantile wealth. Genoa has greatest wealth, as predicted. On September 7th 1298 Genoa defeated the Venetian fleet in battle. Size of nodes adjusted to indicate differences in betweenness centrality of trading cities
(Net 7) Flow centrality (how much total network flow is reduced with removal of a node) predicts something entirely different: the potential for profit-making on trade flows. It necessarily reflects flow velocities central to the organizational transformations undergone in different cities, as Spufford argues. This type of centrality is conceptually very difference and distributes very differently than betweenness and strategic centers like Venice or Genoa, which are relatively low in flow centrality.
Flow centrality (how much total network flow is reduced with removal of a node) reflects the potential for profit making on trade flows, and reflects the flow velocities that Spufford argues are central to the transformations that different cities undergo. Indeed, at the high end are Bruges, undergoing commercial transformation, Troyes of the Champaign Fairs, Malaga, engaged in transformation at the Muslim/Christian frontier, and Tunis, involved in Muslim political transformation, Troyes is engaged in a transformation of agent space involving money and trade representatives that leads to the migration of the Provins nobility, the wealthiest in France, to the new political capital at Paris at century's end
Some rough observations Next: The first modeling problem is to take the constraint set for each time period - raw material sources for production, distribution of producers, location and magnitude of consumer population, cost and risk of available trade route usage, and political configurations, including warfare, and derive the commodity trade flows and magnitudes among nodes as (1) a linear program problem given marketing sites or (2) an agent-based simulation in which mercantile agency and marketing sites transform and co-evolve with changes in trade flows
Learning to overlay networks on geophysical terrains (press for GIS images) A preview of things to come: the network shown will be capable of changing dynamically from the activated website to show evolution through time. The svg projection also has the capability of showing agents moving over the network and geographic space
The network variables are not static but changing in terms of flow velocity and magnitude
Among the structural changes in the network are the developments in commodity production studied through time by means of: (1) entailment analysis (2) lattices In the figures below for each of the 14 time periods the cyan nodes along the bottom of the graphs represent varying populations scaled from >200,000 >100,000 >50,000 >20,000 >10,000 Other nodes are sized according to their frequency distribution among cities 1=yellow, 2=green, 3=red and so forth (large blue dot for woolens has incomplete data) Except for the mutual exclusion between linens and ports, a directed line indicates that populations producing one item (or of an entailed size) will also be producing the other item (or be of the size entailed) Here, between 1175 and 1200, silk production is moving down the town-size hierarchy, while manuscript production is appearing in 1200 in the largest city (Paris) but is always found in those with >50,000 (Paris and Arras); pottery and papermaking co-occur in both time periods but not in association with any specific population sizes 1175 1200
1325 1350 1225, adds:glass >100,000 and armor (→linens) entail cottons 1250, silk moves back up and entails cottons (→ 20K) 1275, adds: artworks→20K, coal& armor entail brassworks 1300, e.g., paper & armor shift to towns >10K and 20K
Structural reorganization of the urban hierarchy 1325 e.g.,fustians come into entailment 4-chain with cottons >10K 1350 e.g., cottons replaced by fustians >10K, → linens 1375 e.g., paper moves up the size hierarchy > 50K, → silk→ 1400 e.g., linens enter entailment 5-chain with fustians >10K