Download
1 / 24
240 likes | 363 Views
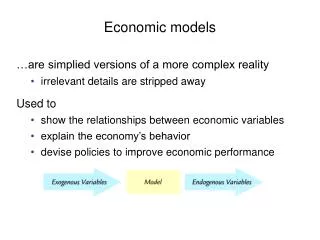
Freight models, constrained economic models and natural resource data. TRB, Washington, 21 October 2013 Ming Chen, TNO. The need for a restricted model Conceptual framework Model suite TNO Examples of application and advantages Next steps. Context. Recent history: Climate debate

E N D
Freight models, constrained economic models and natural resource data TRB, Washington, 21 October 2013 Ming Chen, TNO
Ming Chen, TNO • The need for a restricted model • Conceptual framework • Model suite TNO • Examples of application and advantages • Next steps
Ming Chen, TNO Context Recent history: • Climate debate • Ongoing and visible trend breaks (energy, food, water scarcity) • Upcoming (large) economies (BRIC) • Financial reset (changing approach towards debts) • Energy independence (EU: import oil & gas 1.1 Billion/day) As a consequence: • Long term solutions/policies required • Long term assessment and forecasting required (often upto 2050) • Additional mega trends to be taken into account => Boundaries become visible
Ming Chen, TNO Approaching the problem at the right level…
Ming Chen, TNO Table: Moment where production growth is smaller than growth of demand Danger zone: < 30 years • Note: indicative figures not derived from our model
Ming Chen, TNO Implications of scarcity non-replaceable natural resources Economic principles: • Insufficient supply > increase price > reduced demand • Increase in price > production at higher costs possible > more supply In this case: no production at lower costs will return > products using scarce resources price increase and substitutes only available at higher costs > reduced demand > negative effect on economy as a whole (unless new cheaper technology or alternatives become available) Example: oil off shore drilling So restricted economic growth models required
Ming Chen, TNO What to expect • Scarcity on some natural resources including labor, land use, energy, water, … • Efficiency in use of scarce resources • Transition to less scarce resources • Large scale innovations • Societal change • Changing trade relations • Reallocation of welfare in the world ?
Ming Chen, TNO Conceptual Freight Modeling Framework
Ming Chen, TNO Models available at TNO
Ming Chen, TNO Current Model flow
Ming Chen, TNO Characteristics of the models
Ming Chen, TNO EXIOMOD Model Sectoral / Regional Dimension Interesting features Main outputs Possible applications EXIOMOD • Main countries of the world • 164 industries and service sectors, 200 commodities • Uses results of EXIOPOL • Linking physical and economic flows • Very detailed environmental and energy dimension • International trade • Emissions and waste • Use and extraction of natural resources • Changes in technologies • Sustainability issues • Climate change • Energy transition • Competitiveness of European countries • Unique elements: • Represents95% of global economy (43 countries incl. EU27, US, Japan, Russia, Brazil, India and China) • Much detail on Social effects, Economic effects, Environmental effects • Semi-endogenous growth under the framework of Dynamic Stochastic General Equilibrium. (dynamic, recursive over time) • Agent-based modeling of expectation formation and technology adoption • Dynamics of capital accumulation and technology progress, stock and flow relationships and adaptive expectations.
Ming Chen, TNO RAEM-Europe Model Sectoral / Regional Dimension Interesting features Main outputs Possible applications RAEM-Europe • NUTS2 regions of EU27 (271) • 24 industries and service sectors • Combination of NEG with endogenous growth, migration • Linking social, economic and environmental dimensions • Interregional trade • Regional production, consumption, emissions and waste • Migration • European Cohesion Policy • Transport • Environment • Regional economic growth • Unique elements: • Representation of agglomeration and dispersion effects using the framework of new economic geography • Inter-regional migration flows at the level of NUTS2 regions of EU • Endogenous economic growth and inter-regional knowledge spillovers • Two levels of the government • Environmental effects at the regional level • Model choice for different types of trips • Amount of transport infrastructure investments is related to the road capacity and transport costs
Ming Chen, TNO Examples of application and advantages
Ming Chen, TNO Example: Innovation scenarios for the building sector Figure: Improvement of material efficiency as measured in material used per unit of output in the baseline scenario
Ming Chen, TNO Example non-EU developments to EU regional impacts
Ming Chen, TNO Internalization of external costs • Results: • Limited impact on global economy (-0.9%) • Limited impact on container flows through port of Rotterdam (-0.5%) • Benefits (external) higher than costs (internal), ratio 2.6 : 1
Ming Chen, TNO Advantages • Improved prediction of international trade for 200 types of commodities • Improved prediction of bulk flows, • Improved assessment of external impacts including water and land use as well as generation of waste flows which will impact for instance the assessments of infrastructure needs for ports and the inland modes and policies of at each level (national, regional).
Ming Chen, TNO Improvement: Conversion factor module and scenarios for value-weight ratios
Ming Chen, TNO Improvement: Transportation/logistics costs input to Economic module
Ming Chen, TNO Example EU regional development and global impacts
Ming Chen, TNO Overview of project experiences used for this presentation • FP 7 HIGH-TOOL => development of a high level transport model • FP 7 ETISplus => European Transport policy Information System • FP 7 FLAGSHIP => Forward looking assessment driving change • FP 7 DESIRE => Development of resource efficiency indicators • FP 7 Emininn => Environmental macro Indicators of Innovation • FP7 - POLFREE (POLicy options For a Resource Efficient Economy) • FP7 CREEA => Compiling and Refining Environmental and Economic Accounts • RHOMOLO project for DG REGIO and IPTS => construction of regional-economic model for Impact Assessment of ECP
Ming Chen, TNO Overview of project experiences used for this presentation • FP6 EXIOPOL => A New Environmental Accounting Framework Using Externality Data and Input-Output Tools for Policy Analysis • FP6 REFIT => REFinement and test of sustainability Indicators and Tools with regard to European Transport • FP 6 TRANS-TOOL => development of a Transport model