Download
1 / 21
240 likes | 368 Views
Contribution of contaminated sites to the global mercury budget M ilena Horvat 1 , David Kocman 1 , N icola Pirrone 2 , S ergio Cinnire l la 2 1 Jožef Stefan Institute, Ljubljana, Slovenia 2 CNR-Institute of Atmospheric Pollution Research , Rome and Rende , Italy.

E N D
Contribution of contaminated sites to the global mercury budget Milena Horvat1, David Kocman1, Nicola Pirrone2, Sergio Cinnirella 2 1Jožef Stefan Institute, Ljubljana, Slovenia 2CNR-Institute of Atmospheric Pollution Research, Rome andRende, Italy 3rdsessionofthe INC on a Hg instrument Nairobi, 2nd November, 2011
Content • The extent and global distribution of Hg contaminated sites(by Hg source category; by continents) • Contribution of contaminated sites to the global mercury budget • Quantification of Hg emissions • Hg spreading through hydrological cycles
BrCl + hv Br/Cl Br2 + hv 2Br Br/Cl + O3 BrO/ClO + O2 BrO/ClO + Hg0 Br/Cl + HgO BrOH/ClOH + Hg0 HBr/HCl + HgO 2Br/2Cl + Hg0 HgBr2/HgCl2 hv Hg(0) Long-range transport Cl2/Br2 Hg(II)/ aerosols Wet/Dry Deposition Hg(0) Soil Emission/ Biomass burning Hg(0) Local deposition Hg(II) hv Hg(0) hv (III) Sea Ice/ snow hv Surface microbes Hgp hv Industry food web XHgCH3 Hg(II) Reduction zooplankton fish (II) Soil and vegetation (I) Water/lakes/Ocean Mercury Transformations in Atmosphere & at the air/water/snow/soil Interfaces
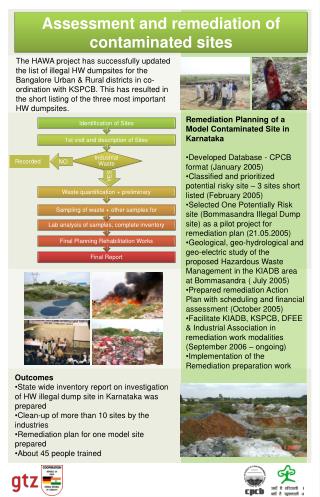
What is a contaminated site? • "A site at which hazardous substances occur at concentrations above background levels and where assessment indicates it poses, or is likely to pose an immediate or long-term hazard to human health or the environment." ANZECC (1992)
What is a hot spot? “The definition of hot spots depends upon the medium that is contaminated. Generally, for water, a hot spot exists if contamination results in a significant adverse effect on the beneficial use of that resource and if restoration or protection of the beneficial use can occur within a reasonable amount of time. For media other than water, a hot spot exists if the site presents an unacceptable risk and if the contamination is highly concentrated, highly mobile or cannot be reliably contained.” DEQ, 1998
The extent of contaminated sites • CONCENTRATED “HOT SPOTS” • Active • Intentional (use of Hg in processes and products) • Non intentional (Hg as by-product) • Historical • (mining, industrial waste, sludge…) • DISPERSED • Catchments impacted by Hg • Coastal areas impacted by Hg
Inventory of contaminated sites by source category • Mercury mining and smelting • Chlor-alkali industry • Precious metal processing: large scale • Artisanal and small-scale gold mining • Non-ferrous metal production • Other industrial and urban sites • Acetaldehyde production • Vinyl chloride and vinyl acetate • Oil refineries • Urban landfilds
Mercurycontaminatedsites • GLOBAL PRESPECTIVE: • 70% of CS concentrated in industrial regions of Europe and N America • Asia, India: number of CS increasing due to rising use of Hg in various products and processes
CSs vs. meteorological and land cover conditions New Almaden Releases: 4-30 kg/yr* Idrija Production: 120.000 t Precipitation: 2000 mm Releases: 1000 kg/yr New Idria Production: 17.000 t Precipitation: 330 mm Releases: 1.5 kg/yr** * Thomas et al., Geochem(2002), **Ganguli et al., ES&T (2000)
Quantification of Hg emissionsfrom contaminated sites – data needs • Characterization and identification of CS: • Extent and spatial distribution of contamination (Hg content in soils, delineation of “hot spots”…) • Transport between compartments (erosion rates, surface/air exchange) • Differential absorption lidar technique, portable instruments (e. Lumex), flux chamber experiments…
Hg releases into the hydrosphere - data availability Releases of Hg from CSs – literature overview: • Poorly documented • Short observation periods not adopted to meteorological conditions • Difficult to determine relative contribution of the contaminated part of the catchment • Coexistence of various types of Hg contaminated sites Case studies - lessons learned: • Variability in releases (production, Hg content, control equipment, mitigation, process…) • Releases are significant: up to hundreds of kg/yr/site • Meteorological conditions the most important factor controlling releases – majority of transport occurs during flood events
Quantification of Hg emissionsandreleases – modeling approach Hgrelease to aquaticsystems Erosion and runoff depend on land cover/use, geology, pedology, topography, precipitation… Hgatmosphericemission Emissions depend on substrate, Hg content, soil temperature, solar radiation, soil moisture
Mercury atmospheric and terrestrial flux from contaminated sites
Contaminated sites vs. meteorological and land cover conditions Temperature Precipitation Vegetationcover
Global Mercury Emissions Natural 5207 Anthropogenic 2320 Volcanoes 90 Forest fires 675 Forest & agriculture 1664 Oceans 2778 Global Emission (2008): 7438 Mg yr-1 Source: Pirrone et al. ACP, 2010
Global Mercury Emissions in Mg yr-1 Anthropogenic 2320 Global Emission (2008): 7438 Mg yr-1 Natural 5207 (~ 4 %) 70 - 110 Rivers to estuaries (1320 -2760) (70 -165) (~ 5 %) Rivers to open waters • (280-480) (7-16) Redistributionbycurrents (5-10) Historicaccumulation (5000 – 10 000) Sources: Pirrone et al. ACP, 2010 Sunderland and Mason, 2007
Conclusions (I) • Total Hg emissionsandreleases from contaminated sites are between 140- 275 tons per year. • Hg releases to the hydrosphere are in the same order of magnitude as the atmospheric emissions. • >40% of contaminated sites are located at the coast and have for decades introduced waste containing mercury directly into local estuaries (5000 to 10000 tons accumulated).
Conclusions (II) • Mercury emissions and releases from contaminated depend strongly on the climatic conditions and the topography of the site in question. • Comparability of data reported in different studies is also questionable due to different approaches used – standardization is needed.
Whatneeds to done? • Standardized tools to identify and characterise contaminated sites and quantify Hg emissions and releases • Training and capacity building at a country level • Improved inventories of contaminated sites
To remember • Releasesandemission from contaminated sites are less than 10 % of the total global anthropogenic Hg release. However, contaminated sites will release Hg for a very long time, if not managed properly and/or remediated. • Inappropriate management of contaminated sites may further increaseHg releases resulting in an increased risk for local populations and ecosystem. • Remediation of such sites can be expensive, and the decisions are difficult to take because the issue is complex.