Download
1 / 40
400 likes | 639 Views
Part II The Baldrige Model of Performance Excellence. Prepared for: The Cedar Rapids Community Schools Board of Education July 26, 2004. Baldrige In the Classroom. If a visitor came to a classroom that was using the Baldrige approach to continuous improvement…. they would see….

E N D
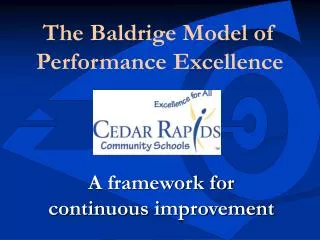
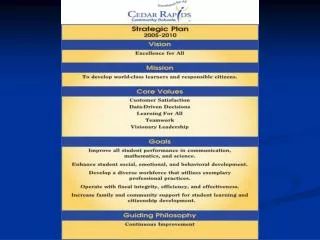
Part II The Baldrige Model of Performance Excellence Prepared for: The Cedar Rapids Community Schools Board of EducationJuly 26, 2004
If a visitor came to a classroom that was using the Baldrige approach to continuous improvement…
they would see… • The classroom mission statement • Classroom goals and measures and data indicating progress • +/Delta from the previous day/class • Action plan for the day • Chairs/desks/tables arranged to support collaborative work in achieving classroom goals
Classroom Mission Statement Mission Statements define a purpose for the teacher, students, parents, and other key stakeholders of the learning environment.
They would also see… • The school mission and the school goals • Grade-level/course standards in kid-friendly language • Regular class meetings during which goals are reviewed, progress is shared, ideas for improving the classroom learning system are shared • Evidence of the use of quality tools
Histogram Consensogram Lotus Diagram Force Field Analysis Fishbone Diagram Radar Chart Pareto Diagram Brainstorming Flow Chart Plus/Delta Check Sheet Affinity Diagram Light Voting Scatter Diagram Examples of Quality Tools
They would hear… • The teacher talking to students about what’s important • The students talking to the teacher about how we can work together to achieve what’s important • Students talking to the teacher about their personal goals and action plans • Students asking their teacher for assistance in achieving their personal goals • Students talking to students about class and personal goals and strategies for achieving them
They would also see… • Students talking to visitors about the classroom learning system, the class mission, goals and measures • Student-led conferences with parents to share progress toward learning goals • Students and their teacher utilizing PDSA to solve real classroom problems
What Is PDSA? • Plan • Do • Study • Act
P-D-S-A • Is a step by step method of scientific problem solving • Is designed to assist teams/individuals improve a process • Is based on data collection and analysis
Plan for Continuous Improvement Define the System Standardize Improve-ments ACT Assess Current Situation PLAN STUDY Study The Results DO Try Out Improvement Theory Analyze Causes
Using PDSA to Improve Math
Define the System • Students entering 4th grade did not demonstrate mastery of their multiplication facts. • We created a project statement of purpose: To improve multiplication facts of the 4th graders as measured by the number of errors made on weekly multiplication timed tests.
Define the System We created an Operational Definition with 2 quality measures: 1. The number of errors on weekly tests 2. Students’ attitudes toward multiplication facts
Define the System To help define the system: • A Check Sheet would be used to measure what factors were missed most frequently. and • A Radar Chart would be used to measure how they felt about each of the factors 1 – 12.
Check Sheet Example 10/16 10/23 10/30
Plan for Continuous Improvement Define the System Standardize Improve-ments ACT Assess Current Situation PLAN STUDY Study The Results DO Try Out Improvement Theory Analyze Causes
Assessing the Situation • The class added the tallies from the check sheet and then made a Pareto Diagram to show which factors were the hardest for the students. • The class then looked at how each student marked the Radar Chart regarding how well they felt they knew their multiplication facts. All of these scores were then averaged for a class Radar Chart. We will do this again after we have tried out our improvement theory.
Analyze the Cause • We worked together as a class to determine what could be causing us to not be able to do better on our weekly timed math tests. • We made a Fishbone (also called a Cause and Effect Diagram) to help us list and talk about the areas which may be preventing the class members from doing their best.
Plan for Continuous Improvement Define the System Standardize Improve-ments ACT Assess Current Situation PLAN STUDY Study The Results DO Try Out Improvement Theory Analyze Causes
Improvement Theory If students study the math facts which are most difficult for them by using their flashcards for at least 20 minutes every day after school, then students will see an increase in the percentage of correct problems on weekly timed tests.
Plan for Continuous Improvement Define the System Standardize Improve-ments ACT Assess Current Situation PLAN STUDY Study The Results DO Try Out Improvement Theory Analyze Causes
Trying Out the Improvement Theory While we were trying out our Improvement Theory, we collected new information on a check sheet which asked for the same kind of information that was collected when we were trying to Assess the Current Situation.
Plan for Continuous Improvement Define the System Standardize Improve-ments ACT Assess Current Situation PLAN STUDY Study The Results DO Try Out Improvement Theory Analyze Causes
Study the Results • As a class we looked at the information which was collected when we were trying out our improvement theory. • We took the new information and added it to the Pareto Diagram so we could see where we improved and where we need more work.
Plan for Continuous Improvement Define the System Standardize Improve-ments ACT Assess Current Situation PLAN STUDY Study The Results DO Try Out Improvement Theory Analyze Causes
Standardize the Improvements • As a class we made a flow chart which would help students know what to do if they became stuck while studying their facts at home or at school. • Students had two copies of this flow chart, one at home and one at school so they would always know what to do.
Plan for Continuous Improvement Define the System Standardize Improve-ments ACT Assess Current Situation PLAN STUDY Study The Results DO Try Out Improvement Theory Analyze Causes
Plan for Continuous Improvement – Affinity Diagram Students worked on creating an Affinity Diagram to help show what factors students were still feeling unsure about knowing. The notes from the Affinity Diagram were shared with the class, and the class brainstormed ideas as to how they could improve on the factors that were still giving some students in the class difficulties. As a class we took the factors which were still difficult for some and analyzed the causes and then made a new plan of improvement.
Repeat the Cycle • Plan • Do • Study • Act
August 16, Part III… Baldrige and the Board… Shipley and Associates: A Guide for Practitioners – Using the Baldrige Approach for School Improvement and Performance Excellence