Download
1 / 1
10 likes | 84 Views
0.5m. P2-59 Mass changes in NSTX surface layers with Li conditioning as measured with quartz microbalances.

E N D
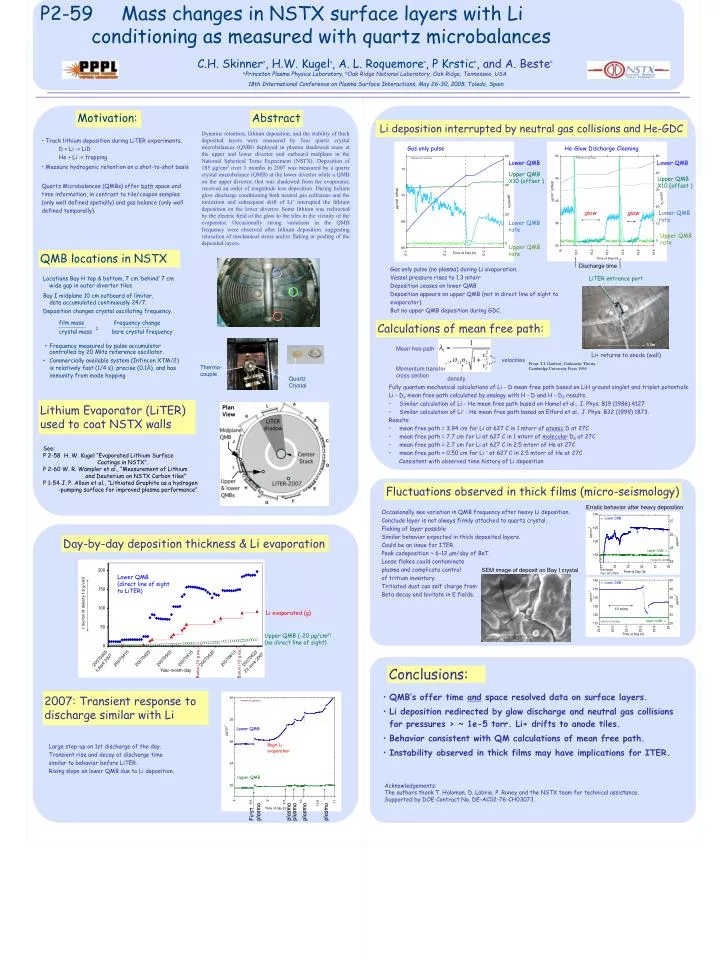
0.5m P2-59 Mass changes in NSTX surface layers with Li conditioning as measured with quartz microbalances C.H. Skinnera, H.W. Kugela, A. L. Roquemorea, P Krsticb, and A. BestebaPrinceton Plasma Physics Laboratory, bOak Ridge National Laboratory, Oak Ridge, Tennessee, USA 18th International Conference on Plasma Surface Interactions, May 26-30, 2008, Toledo, Spain Motivation: Abstract Li deposition interrupted by neutral gas collisions and He-GDC Dynamic retention, lithium deposition, and the stability of thick deposited layers were measured by four quartz crystal microbalances (QMB) deployed in plasma shadowed areas at the upper and lower divertor and outboard midplane in the National Spherical Torus Experiment (NSTX). Deposition of 185 µg/cm2 over 3 months in 2007 was measured by a quartz crystal microbalance (QMB) at the lower divertor while a QMB on the upper divertor, that was shadowed from the evaporator, received an order of magnitude less deposition. During helium glow discharge conditioning both neutral gas collisions and the ionization and subsequent drift of Li+ interupted the lithium deposition on the lower divertor. Some lithium was redirected by the electric field of the glow to the tiles in the vicinity of the evaporator. Occasionally strong variations in the QMB frequency were observed after lithium deposition. suggesting relaxation of mechanical stress and/or flaking or peeling of the deposited layers. • • Track lithium deposition during LiTER experiments. D + Li -> LiD He + Li -> trapping • • Measure hydrogenic retention on a shot-to-shot basis • Quartz Microbalances (QMBs) offer both space and time information, in contrast to tile/coupon samples (only well defined spatially) and gas balance (only well defined temporally). Gas only pulse He-Glow Discharge Cleaning Lower QMB Lower QMB Upper QMB X10 (offset ) Upper QMB X10 (offset ) glow glow Lower QMB rate Lower QMB rate Upper QMB rate Upper QMB rate QMB locations in NSTX Discharge time Gas only pulse (no plasma) during Li evaporation. Vessel pressure rises to 1.3 mtorr Deposition ceases on lower QMB Deposition appears on upper QMB (not in direct line of sight to evaporator). But no upper QMB deposition during GDC. Locations Bay H top & bottom, 7 cm ‘behind’ 7 cm wide gap in outer divertor tiles Bay I midplane 10 cm outboard of limiter, data accumulated continuously 24/7. Deposition changes crystal oscillating frequency. • Frequency measured by pulse accumulator controlled by 20 MHz reference oscillator. • Commercially available system (Infincon XTM/2) is relatively fast (1/4 s), precise (0.1Å), and has immunity from mode hopping LiTER entrance port film mass frequency change crystal mass bare crystal frequency Calculations of mean free path: = Mean free path Li+ returns to anode (wall) velocities From: T.I. Ganbosi, Gaskinetic Theory, Cambridge University Press 1994 Thermo-couple Momentum transfer cross section Quartz Crystal density Fully quantum mechanical calculations of Li - D mean free path based on LiH ground singlet and triplet potentials. Li - D2 mean free path calculated by analogy with H - D and H - D2 results. • Similar calculation of Li - He mean free path based on Hamel et al., J. Phys. B19 (1986) 4127 • Similar calculation of Li+ - He mean free path based on Elford et al., J. Phys. B32 (1999) 1873. Results: • mean free path = 3.94 cm for Li at 627 C in 1 mtorr of atomic D at 27C • mean free path = 7.7 cm for Li at 627 C in 1 mtorr of molecular D2 at 27C • mean free path = 2.7 cm for Li at 627 C in 2.5 mtorr of He at 27C • mean free path = 0.50 cm for Li + at 627 C in 2.5 mtorr of He at 27C Consistent with observed time history of Li deposition Lithium Evaporator (LiTER) used to coat NSTX walls Plan View See: P 2-58 H. W. Kugel “Evaporated Lithium Surface Coatings in NSTX”. P 2-60 W. R. Wampler et al., “Measurement of Lithium and Deuterium on NSTX Carbon tiles” P 1-54 J. P. Allain et al., “Lithiated Graphite as a hydrogen -pumping surface for improved plasma performance” Fluctuations observed in thick films (micro-seismology) Erratic behavior after heavy deposition Occasionally see variation in QMB frequency after heavy Li deposition. Conclude layer is not always firmly attached to quartz crystal. Flaking of layer possible Similar behavior expected in thick deposited layers. Could be an issue for ITER. Peak codeposition ~ 6-12 µm/day of BeT. Loose flakes could contaminate plasma and complicate control of tritium inventory. Tritiated dust can self charge from Beta decay and levitate in E fields. Day-by-day deposition thickness & Li evaporation SEM image of deposit on Bay I crystal Discharge Turn off LiTER Lower QMB (direct line of sight to LiTER) 1 micron at density 1.6 g/cm3 10 mins Li evaporated (g) Upper QMB (-20 µg/cm2) (no direct line of sight) 23 June 2007 5 April 2007 Boron (10 g ea.) Boron (10 g ea.) Conclusions: • QMB’s offer time and space resolved data on surface layers. • Li deposition redirected by glow discharge and neutral gas collisions for pressures > ~ 1e-5 torr. Li+ drifts to anode tiles. • Behavior consistent with QM calculations of mean free path. • Instability observed in thick films may have implications for ITER. 2007: Transient response to discharge similar with Li Large step-up on 1st discharge of the day. Transient rise and decay at discharge time similar to behavior before LiTER. Rising slope on lower QMB due to Li deposition. Acknowledgements: The authors thank T. Holoman, D. Labrie, P. Roney and the NSTX team for technical assistance. Supported by DOE Contract No. DE-AC02-76-CH03073. First plasma plasma plasma plasma plasma