Download
1 / 1
10 likes | 122 Views
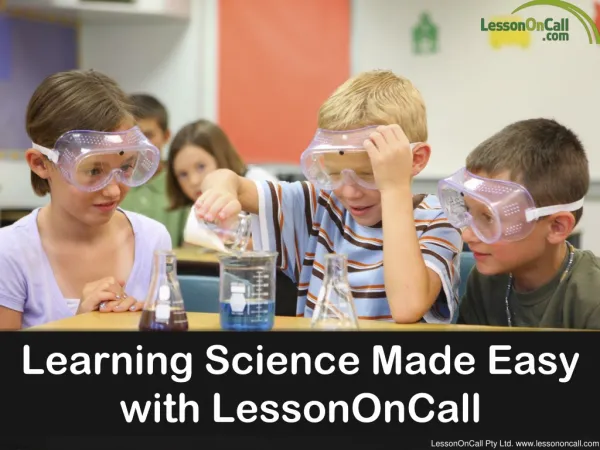
This project explores how students can use sensors to measure sound levels in a clapping contest, enhancing their understanding of graphs and data interpretation. By recording and analyzing claps in separate rooms, students learn to count sound levels over time, compute averages, and relate these measurements to time intervals. The program aims to help children connect sensory experiences with numerical data, making graphs a powerful tool for communicating events. This innovative approach is part of a larger educational initiative at the University of Amsterdam focusing on hands-on science learning.

E N D
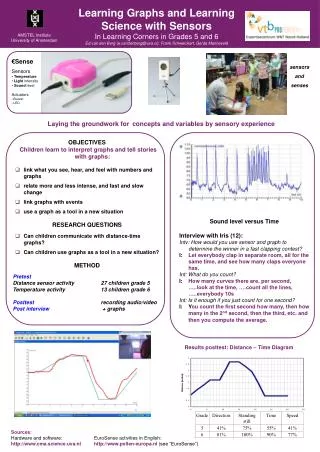
€Sense • Sensors • Temperature • Light intensity • Sound levelActuators • Buzzer • LED Sound level versus Time Interview with Iris (12): Intv: How would you use sensor and graph to determine the winner in a fast clapping contest? I: Let everybody clap in separate room, all for the same time, and see how many claps everyone has. Int: What do you count? I: How many curves there are, per second, …..look at the time, ….count all the lines, …..everybody 10s Int: Is it enough if you just count for one second? I: You count the first second how many, then how many in the 2nd second, then the third, etc. and then you compute the average. Learning Graphs and Learning Science with Sensors In Learning Corners in Grades 5 and 6Ed van den Berg (e.vandenberg@uva.nl), Frank Schweickert, Gerda Manneveld AMSTEL InstituteUniversity of Amsterdam sensors and senses Laying the groundwork forconcepts and variables by sensory experience • OBJECTIVES • Children learn to interpret graphs and tell stories with graphs: • link what you see, hear, and feel with numbers and graphs • relate more and less intense, and fast and slow change • link graphs with events • use a graph as a tool in a new situation • RESEARCH QUESTIONS • Can children communicate with distance-time graphs? • Can children use graphs as a tool in a new situation? • METHOD • Pretest • Distance sensor activity 27 children grade 5 • Temperature activity 13 children grade 6 • Posttest recording audio/video • Post interview + graphs Results posttest: Distance – Time Diagram Sources: Hardware and software: http://www.cma.science.uva.nl EuroSense activities in English: http://www.pollen-europa.nl (see “EuroSense”)