Download

1 / 23
240 likes | 369 Views
Associations between Wyoming Third Grade Body Mass Index and the School Food Environment. Marilyn Hammond. Introduction. Senate File 93 Authorized 2009 Wyoming’s first “Oral Health Initiative” Body Mass Index (BMI) measurements taken on a subset of 3 rd graders Current Study

E N D
Associations between Wyoming Third Grade Body Mass Index and the School Food Environment Marilyn Hammond
Introduction • Senate File 93 • Authorized 2009 • Wyoming’s first “Oral Health Initiative” • Body Mass Index (BMI) measurements taken on a subset of 3rd graders • Current Study • Goal: Evaluate the potential effects of individual and school factors on being overweight or obese • Hypothesis: Children in schools with policies and practices encouraging healthy eating and limiting unhealthy foods would have a reduced odds of being overweight or obese than schools without these practices
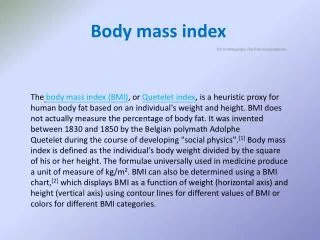
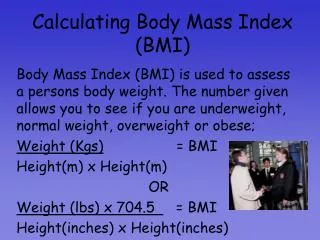
Background • Overweight and obesity are conditions defined as having excess body fat • BMI, calculated from an individual’s height in relation to weight, does not measure body fat, but is highly correlated with direct measures of body fat • Child and adolescent BMI is age and sex specific
Background • Nationally, 32% of children ages 10 to 17 are overweight and 16% are obese • In Wyoming, 26% of children ages 10 to 17 are overweight and 10% are obese Prevalence of Overweight and Obese Children Ages 10-17 Years in the U.S., NSCH 2007 Source: National Survey of Children’s Health, 2007
Background • Childhood Obesity increases: • Cardiovascular and pulmonary issues • Hepatic, renal, musculoskeletal, orthopedic and neurological problems • Early maturation and menstrual irregularities • Development, learning, behavioral and emotional problems • Discrimination, stigma, shame, low self-esteem • Risk of becoming an obese adult
Factors that Influence Becoming Overweight or Obese • Children becoming overweight and obese is the result of a positive energy imbalance: too many calories are consumed and too few are expended • Genetic • Metabolic • Environmental • Dietary • Behavioral • Cultural • Socioeconomic
School Food Environment • Children expend ≈ 50% of their daily energy and obtain 33%-58% of their daily energy at school • The School Food Environment consists of: • School Food Policies • United State Department of Agriculture (USDA) National School Lunch and Breakfast Programs • School wellness program • Department of Defense’s Fresh Fruit and Vegetable Program (DOD FFVP) • Recess before lunch • Competitive Foods • Pouring Rights Contracts • USDA’s Fresh Fruit and Vegetable Program (USDA FFVP)
Data Collection • 2009-2010 Oral Health Survey • Height • Weight • Age • Gender • School Food Environment Characteristics were collected from: • Wyoming Department of Education • USDA Foods Distribution Program • U.S. Census Bureau • Wyoming School Nurses • School District Business Directors • School District Food Service Directors • School Menus
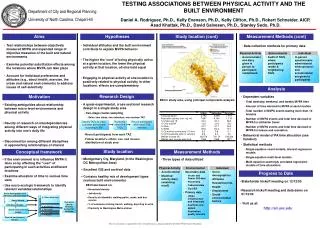
Methods • Study Aims • Evaluate the associations between overweight and obesity among 3rd grade students and the school characteristics in this study • Develop multiple logistic regression models to describe the relationship of overweight and obesity with school characteristics in this study along with adjustment for confounding variables • Compare the associations found for overweight to the associations found for obesity • Study Design • Ecological cross-sectional survey using a subset of participants in the 2009-2010 Wyoming Oral Health Survey
Outcome Variables • Outcome Groups • Overweight • Obese • Reference Group • Underweight and normal weight
Other Variables • Age • Gender • Region - East vs. Central/West • Urban or rural school location • School percent of students eligible for free or reduced lunch – low (below 50%) vs. high (above 50%) • School percent of students in a minority racial or ethnic group – low (below 34%) vs. high (above 34%) • School enrollment size
Results • Participation • 42 out of 55 (76.4%) schools participated • 1570 children out of 2012 (78%) of children in the 42 participating schools participated • Study Population • Gender • 816 (52%) were male and 754 (48%) were female • Age • 5 (<1%) were 7 years of age • 1173 (75%) were 8 years of age • 385 (25%) were 9 years of age • 8 (<1%) were 10 years of age
Descriptive Statistics: Average School Prevalence of Overweight and Obese Children
Main Effects: Availability of Competitive Foods and Beverages
Factors Influencing Being Overweight in this Study • Using the DOD’s FFVP decreased the odds of students being overweight by 22% (OR: 0.78, 90% CI: 0.56, 1.08) • Offering fresh fruit or raw vegetables daily decreased the odds of students being overweight by 26% (OR: 0.74, 90% CI: 0.54, 1.00)
Factors Influencing Being Obese in this Study • Using the USDA’s FFVP decreased the odds of students being obese by 32% (OR: 0.68, 90% CI: 0.46, 1.00) • Offering fresh fruit or raw vegetables daily decreased the odds of students being obese by 32% (OR: 0.68, 90% CI: 0.44, 1.00)
Discussion • Limitations • Cross sectional • Ecological • Small sample size • Strengths • High participation • Agreement between overweight and obese models • Results applicable at an ecological level • Conclusions • These study results show that schools that make fresh fruits and vegetables available to children may reduce the odds of them being overweight or obese