Download
1 / 1
10 likes | 108 Views
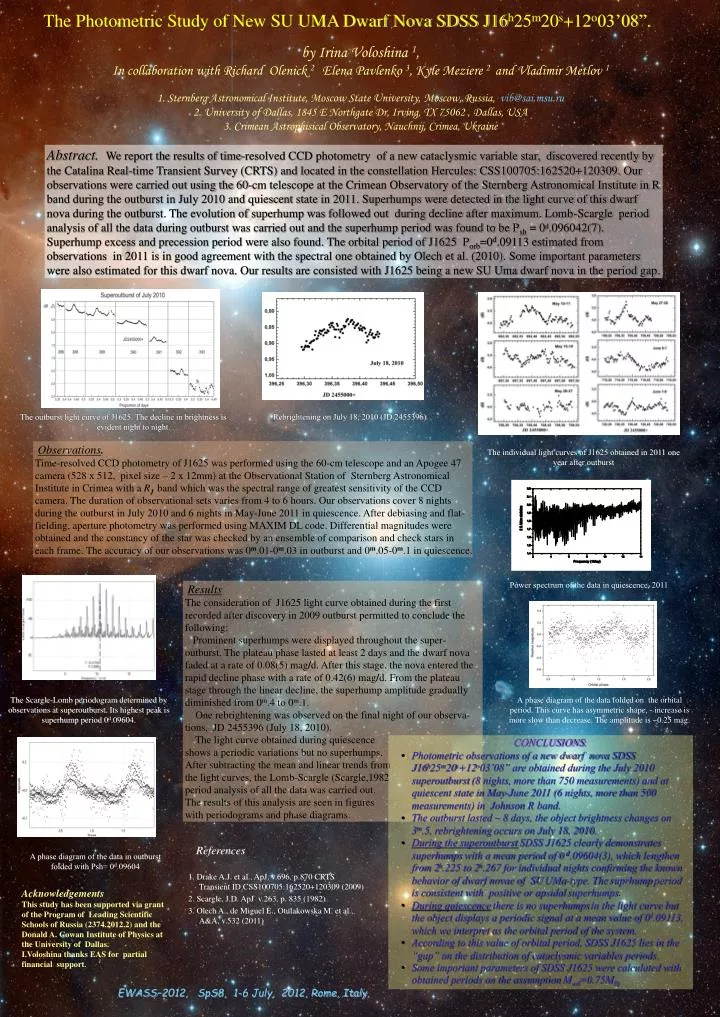
The Photometric Study of New SU UMA Dwarf Nova SDSS J16 h 25 m 20 s +12 o 03’08”. by Irina Voloshina 1 , In collaboration with Richard Olenick 2 Elena Pavlenko 3 , Kyle Meziere 2 and Vladimir Metlov 1

E N D
The PhotometricStudyof New SU UMA Dwarf Nova SDSS J16h25m20s+12o03’08”. by Irina Voloshina 1, In collaboration with Richard Olenick 2 Elena Pavlenko 3, Kyle Meziere 2 and Vladimir Metlov 1 1. Sternberg Astronomical Institute, Moscow State University, Moscow, Russia, vib@sai.msu.ru 2. University of Dallas, 1845 E Northgate Dr, Irving, TX 75062 ,Dallas, USA 3. Crimean Astrophisical Observatory, Nauchnij, Crimea, Ukraine Abstract. We report the results of time-resolved CCD photometry of a new cataclysmic variable star, discovered recently by the Catalina Real-time Transient Survey (CRTS) and located in the constellation Hercules: CSS100705:162520+120309. Our observations were carried out using the 60-cm telescope at the Crimean Observatory of the Sternberg Astronomical Institute in R band during the outburst in July 2010 and quiescent state in 2011. Superhumps were detected in the light curve of this dwarf nova during the outburst. The evolution of superhump was followed out during decline after maximum. Lomb-Scargle period analysis of all the data during outburst was carried out and the superhump period was found to be Psh = 0d.096042(7). Superhump excess and precession period were also found. The orbital period of J1625 Porb=0d.09113 estimated from observations in 2011 is in good agreement with the spectral one obtained by Olech et al. (2010). Some important parameters were also estimated for this dwarf nova. Our results are consisted with J1625 being a new SU Uma dwarf nova in the period gap. Rebrighteningon July 18, 2010 (JD 2455396) The outburst light curve of J1625. The decline in brightness is evident night to night. Observations. Time-resolved CCD photometry of J1625 was performed using the 60-cm telescope and an Apogee 47 camera (528 x 512, pixel size – 2 x 12mm)at the Observational Station of Sternberg Astronomical Institute in Crimea with a RJ band which was the spectral range of greatest sensitivity of the CCD camera.The duration of observational sets varies from 4 to 6 hours. Our observations cover 8 nights during the outburst in July 2010 and 6 nights in May-June 2011 in quiescence. After debiasing and flat-fielding, aperture photometry was performed using MAXIM DL code. Differential magnitudes were obtained and the constancy of the star was checked by an ensemble of comparison and check stars in each frame. The accuracy of our observations was 0m.01-0m.03 in outburst and 0m.05-0m.1 in quiescence. The individual light curves of J1625 obtained in 2011 one year after outburst Power spectrum of the data in quiescence, 2011 Results The consideration of J1625 light curve obtained during the first recorded after discovery in 2009 outburst permitted to conclude the following: Prominent superhumps were displayed throughout the super-outburst.The plateau phase lasted at least 2 days and the dwarf nova faded at a rate of 0.08(5) mag/d. After this stage, the nova entered the rapid decline phase with a rate of 0.42(6) mag/d. From the plateau stage through the linear decline, the superhump amplitude gradually diminished from 0m.4 to 0m.1. One rebrightening was observed on the final night of our observa-tions, JD 2455396 (July 18, 2010). The light curve obtained during quiescence shows a periodic variations but no superhumps. After subtracting the mean and linear trends from the light curves, the Lomb-Scargle (Scargle,1982 period analysis of all the data was carried out. The results of this analysis are seen in figures with periodograms and phase diagrams. The Scargle-Lomb periodogram determined by observations at superoutburst. Its highest peak is superhump period 0d.09604. А phase diagram of the data folded on the orbital period. This curve has asymmetric shape, - increase is more slow than decrease. The amplitude is ~0.25 mag. • CONCLUSIONS: • Photometric observations of a new dwarf nova SDSS J16h25m20s+12o03’08” are obtained during the July 2010 superoutburst (8 nights, more than 750 measurements) and at quiescent state in May-June 2011 (6 nights, more than 500 measurements) in Johnson Rband. • The outburst lasted ~ 8 days, the object brightness changes on • 3m.5, rebrightening occurs on July 18, 2010. • During the superoutburst SDSS J1625 clearly demonstrates superhumps with a mean period of 0 d.09604(3), which lengthen from 2h.225 to 2h.267 for individual nights confirming the known behavior of dwarf novae of SU UMa-type. The suprhump period • is consistent with positive or apsidal superhumps. • During quiescence there is no superhumps in the light curve but • the object displays a periodic signal at a mean value of 0d.09113, which we interpret as the orbital period of the system. • According to this value of orbital period, SDSS J1625 lies in the “gap” on the distribution of cataclysmic variables periods. • Some important parameters of SDSS J1625 were calculated with obtained periods on the assumption Mwd=0.75M • References 1. Drake A.J. et al., ApJ, v.696, p.870 CRTS Transient ID CSS100705:162520+120309 (2009) 2. Scargle, J.D. ApJ v.263, p. 835 (1982) 3. Olech A., de Miguel E., Otulakowska M. et al., A&A, v.532 (2011) A phase diagram of the data in outburst folded with Psh= 0d.09604 Acknowledgements This study has been supported via grant of the Program of Leading Scientific Schools of Russia (2374.2012.2) and the Donald A. Cowan Institute of Physics at the University of Dallas. I.Voloshina thanks EAS for partial financial support. EWASS–2012, SpS8, 1-6 July, 2012, Rome, Italy,