Download
1 / 20
220 likes | 389 Views
Data capture in production of geostatistics. Mrs Diana Makarenko-Piirsalu MSc in Landscape Ecology and Environmental Protection Geolytics OÜ Mere tee 15, Saviranna, Jõelähtme vald, Harjumaa, ESTONIA diana.m.piirsalu @g mx.ch Mob. +372 556 19 636.

E N D
Data capture in production of geostatistics Mrs Diana Makarenko-Piirsalu MSc in Landscape Ecology and Environmental Protection Geolytics OÜ Mere tee 15, Saviranna, Jõelähtme vald, Harjumaa, ESTONIA diana.m.piirsalu@gmx.ch Mob. +372 556 19 636 ESTP course on Geographic Information Systems (GIS): Use of GIS for making statistics in a production environment Statistics Norway, Oslo, 26th to 30th of March 2012 Attribution (by) Licensees may copy, distribute, display and perform the work and make derivative works based on it only if they give the author or licensor the credits in the manner specified by these. http://creativecommons.org/licenses/by/3.0/
You will obtain… • an overview of the basics of data sources for producing grid based statistics • examples from register and combined method census countries • an overview of sources of digital geodata for further analyses
What is Geostatistics? • A class of statistics used to analyze and predict the values associated with spatial or spatio-temporal phenomena. Geostatistics provides a means of exploring spatial data and generating continuous surfaces from selected sampled data points. (Source: http://wiki.gis.com/wiki/index.php/GIS_Glossary/G ) • statistics liked with the location (x;y) on the Earth • methodsforproduction of georeferenced statistics • spatial analyses of georeferenced statistics • focushasbeen on griddedstatistics Source: Öber,S , Springfeldt, P 1991
What is Geostatistics? • Statistics can be geocoded at different scales and geometries: • Most common and traditional way is to geocode statistics based on: • administrative units (polygons) - NUTS, LAU, Enumeration areas, postal areas • statistical units can be represented also by points (centroids of the Statistical units) or lines (streets, rivers) • the thematic delineation as localities, UA, UMZ… • Since 1970 linking statistics with grids has been developing – pioneered by the Statistics of Finland
Methods for producing gridded statistics • Aggregation • Detailed scale point based data are aggregated into grid cell based on the spatial join • Most accurate results can be produced • Disaggregation • downscaling polygon based data (enumeration area, LAU, post codedistrics) into grids using Corine Land Cover and/or Soil Sealing data • as any modelling it contains many assumptions, depends on the scale of data used, data resolution, algorithms • Tend not to reflect the reality accurately
The main decisions before the production of aggregated grid based data • Strategic decisions with long – term influence should be made: • What is the smallest geographical unit in production of grid based statistics? • Coordinate reference system and scale: • Data interoperability issue : • Interoperability with national geodata - national reference system- • Pan – European interoperability – INSPIRE Directive ETRS89 – LAEA (Source:http://inspire.jrc.ec.europa.eu/documents/Data_Specifications/INSPIRE_DataSpecification_SU_v2.0.pdf ) • What datasets are needed ? What data exists on particular country?
Producing aggregated grid statistics… • … main task is to find the best available solution for geocoding statistics with the most detailed spatial feature available for the country • Issues to be considered: • Coverage • Accuracy • Frequency of data updating • It involves linking different datasets (attribute data; spatial data) often based on addresses or in some cases other ID may be in use (building _ID, personal_ID, cadastral number etc) • Link (unique key ) between different data sets should be generated and kept
Data sources for aggregated grid statistics • Enumeration area centroid -What is the area of the biggest EA? In cities the EA centroid might be adequate for producing 1 km grid.Ruralareas EA tendtobebigger. • Existing national registers (x;y) as primary data sources: • National Mapping Agency • Cadastral - parcel centroid • Digital topographic database: • Source for the building geometries • Building centroid • Part of the building centroid • Source for street network - Geocoding based on street segments • Building register (x;y): building centroid or part of the building centroid • Address Register
Address registers are primary data source • Despite of the myriad of projects at European or Global level aimed to harmonize, standardise , enable data interoperability etc address registers differ in each country remarkably • At the broad conceptual (from the georeference point of view) level the difference is: • Object related addresses – • Each building, parcel, street, settlement has exact location (x:y) • Digital street network - interpolated address locations based on the street segment • Mixed approach • All in all – statistics having addresses are possible to link with location in Europe – at different spatial accuracy
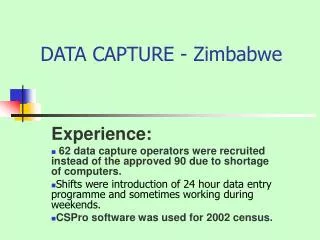
Example of Data capture from Estonia • Mixed census method – partly using registers, e-survey and traditional enumeration • AKP – address updating project improved the address coverage but not at full coverage • Unique ID linking data at building level was generated for data capture process by Stat EE • E-survey : geocoded address data were used + e-survey mapping application was provided - respondents had the possibility to geocode their permanent place of living • Field enumeration – enumerator task is to geocode the addresses : two opportunities: Using mapping application or GPS
Example of Data capture from Finland • Register based census • 1970 – decisionwas made toaddcoordinatesfor all buildingcentroids • Buildng and dwelling register isgeoreferenced • Since 1995 – standardizedgridbasedproductshavebeendisseminated Source: Production and dissemination of grid data since 1970 Census in Finland, 2010 - http://www.efgs.info/presentations/Production%20and%20dissemination%20of%20grid%20data-Finland-e.pdf/view
Different data sources can be used for urban or rural areas • Urban areas : • Building centroid • Part of the building – entrance • Street network • EA centroid • Rural areas : • Parcel centroid
Pan – European Grid • Data can be downloaded from www.efgs.info • http://www.efgs.info/data/eurogrid • CRS ETRS 89 – LAEA • Pan - European statistical grid is specified in INSPIRE D2.8.III.1 Data Specification on Statistical Units • Source:http://inspire.jrc.ec.europa.eu/documents/Data_Specifications/INSPIRE_DataSpecification_SU_v2.0.pdf
Data for Netherlands • http://www.efgs.info/data
Data for Norway • http://www.efgs.info/data
Data for Portugal and France • http://www.efgs.info/data
ESA – open data • ESA - Observing the Earth - ESA opens Landsat archives • www.esa.int
EEA – open data • Environmental data , Urban morpholical zones etc…
Data capture • data capture Any operation that converts GIS data into computer-readable form. Geographic data can be captured by being downloaded directly into a GIS from sources such as remote-sensing or GPS data, or it can be digitized, scanned, or keyed in manually from paper maps or photographs Source: http://wiki.gis.com/wiki/index.php/GIS_Glossary/D • Things to consider: Data should be FIT for purpose • Scale • CRS • Data models • Formats • Coverage and quality issues • Primary or secondary • Processing steps of the data
THANK YOU! Mrs Diana Makarenko-Piirsalu MSc in Landscape Ecology and Environmental Protection Geolytics OÜ Mere tee 15, Saviranna, Jõelähtme vald, Harjumaa, ESTONIA diana.m.piirsalu@gmx.ch Mob. +372 556 19 636 ESTP course on Geographic Information Systems (GIS): Use of GIS for making statistics in a production environment Statistics Norway, Oslo, 26th to 30th of March 2012