Download
1 / 40
570 likes | 1.29k Views
Operations Management Competing with Operations Chapter 1. Why Study Operations Management?. This is where the good or service comes into being – if you do not understand this part of your organization, you are not being the best accountant, marketer, or whatever that you could be.

E N D
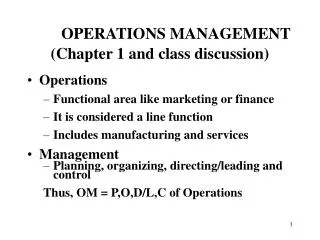
Why Study Operations Management? • This is where the good or service comes into being – if you do not understand this part of your organization, you are not being the best accountant, marketer, or whatever that you could be. • Strategies in all functional areas must be linked and aligned to support the business strategy. • This is where companies focus a great deal of energy – because this is where most companies incur the majority of their costs. Therefore, this is an area where your contribution can have a major impact on a firm’s competitiveness.
Marketing Option Finance Production Sales Costs – 50% Costs – 15% + 50% Options for Increasing Contribution(where is the best leverage?) Finance/Acct OM Option Option Current Sales $100,000 $150,000 $100,000 $100,000 Cost of Goods - 80,000 - 120,000 - 80,000 - 68,000 Gross Margin 20,000 3 0,000 20,000 32,000 Finance Costs - 6,000 - 6,000 - 3,000 - 6,000 Net Margin 14,000 24,000 17,000 26,000 - 3,500 - 6,000 - 4,250 - 6,500 Taxes @ 25% Contribution 10,500 18,000 12,750 19,500
Progressive Insurance • Grew from $1.3 billion to over $11 billion in 13 years • How? better service and low prices through operational innovation • Improved representative response (24 hours a day) • Claims processing reduced from 7-10 days to 9 hours • Claims adjustor drives mobile claims unit to the accident site, writes a check on the spot • Dedicated agents-only web site to improve service • Profitable growth and differentiation in a low-growth industry
Finance Acquires financial resources and capital for inputs Material & Service Inputs Sales Revenue • Support Functions • Accounting • Information Systems • Human Resources • Engineering Operations Translates materials and service into outputs Marketing Generates sales of outputs Product & Service Outputs Across the Organization
Operations Management is… The systematic design, direction and control of processes that transform inputs into services and products for internal, as well as external, customers Transformation Processes(Adding value) Inputs Outputs Processes can be linked together to form a supply chain – integrated processes within a firm and across different firms that produce a service or product to the satisfaction of the customers
Organization Chart General Manager Finance/ Marketing Operations Accounting Production Quality Manufacturing Purchasing Control Control
General manager Finance/ Marketing Operations Accounting Production Quality Manufacturing Purchasing Control Control Cross-functional Linkages • Engineering: what products and processes are needed • Marketing: can we make what we wish to sell / what products cost the most to make / customer expectations • Accounting: inventory management / JIT / work standards / cost verses price • Finance: make verses buy / quantifying quality / cash flow and capital requirements / cost verses price • Human resources: what skills do our employees need / who to hire / type of compensation to match strategy • Information Systems: what information is needed and by whom / flow of goods / linkages to rest of supply chain
Processes and Operations Internal and external customers • Inputs • Workers • Managers • Equipment • Facilities • Materials • Services • Land • Energy • Outputs • Services • Goods Processes and operations 2 3 1 4 5 Information on performance
Process View of an Ad Agency Accounting process • Advertisement design and planning process • Create the ad to the needs of the client and prepare a plan for media exposure • Output interface process • Communicate with client, get needs, and coordinate progress Inputs Outputs • Production process • Prepare ad for publication and deliver to media outlets
Advertisement Design and Planning Process • Creative design process • Receive work request • Assemble team • Prepare several designs • Receive inputs from Account Executive • Prepare final concept • Revise concept per client’s inputs • Media planning process • Receive work request • Prepare several media plans • Receive inputs from Account Executive • Prepare final plan • Revise plan per client’s inputs Nested Processes Accounting process Advertisement design and planning process Output interface process Inputs Outputs Production process
Outputs to Internal or to External customers Inputs from other processes Transformation Processes(Adding value) External vs. Internal Customers • External Customers are those who purchase the goods and services. • Internal Customers are those who receive the output of others within the firm. They are part of the transformation process.
More like a manufacturing process More like a service process A Process View • Physical, durable output • Output can be inventoried • Low customer contact • Long response time • Capital intensive • Quality easily measured • Intangible, perishable output • Output cannot be inventoried • High customer contact • Short response time • Labor intensive • Quality not easily measured Most firms provide both goods and services
Support processes New service/ product development process Customer relationship process External suppliers External customers Supplier relationship process Order fulfillment process Value Chains Interrelated series of processes that produce a service or product to the satisfaction of customers
Strategic Decisions Development of new capabilities Maintenance of existing capabilities Design of new processes Development and organization of value chains Key performance measures Operations as a Set of Decisions Tactical Decisions • Process improvement and performance measures • Management and planning of projects • Generation of production and staffing plans • Inventory management • Resource scheduling
Trends in Operations Management • Globalization of markets and competition • Improved transportation and information technologies • Loosened regulations on financial Institutions (soon to change) • Increased demand for imported goods and services • Reduced import quotas and other trade barriers • Comparative cost advantages • Rapid technological change and productivity improvement • Ethical issues across cultures • Increasing diversity of the workforce • Environmental impact issues • Increased emphasis on risk management (avoid bailout!)
Productivity Productivity = output / input(bigger is better)Single-factor productivity output / labor hours output / labor $ sales / sales rep sales / retail outlet, etcMulti-factor productivity output / (labor + material + overhead)
Single Factor Productivity Three employees process 600 insurance policies in a week. They work 8 hours per day, 5 days/week. Calculate the productivity in policies per hour of work. Policies Processed Employee Hours Labor productivity = = 600 Policies (3 people) x (40 hours/person) = 5 policies/hour
$4,000 $1,700 = 2.35 = Multi Factor Productivity A team of workers makes 400 units of a product, valued by its standard cost of $10 each (before markups for other expenses and profit). The accounting department reports that the actual costs to produce the product are $400 for labor, $1,000 for materials, and $300 for overhead. Calculate the productivity. Quantity at standard cost Labor cost + Materials Cost + Overhead cost MFP = (400 units) ($10/unit) $400 + $1000 + $300 =
Stix Furniture Company Yesterday, the employees at Stix produced 46 chairs. Of the 46 chairs produced, 12 were damaged due to a problem with a new sanding machine. The damaged chairs can be discounted and sold for $25 each. The undamaged chairs are sold to a retail chain for $70 each. Labor costs were $720, material costs were $460, and overhead costs were $500. What was the multi-factor productivity?
Defining the Mission • Provides boundaries and focus to stakeholders • Should be inspirational • Answers the questions: • WHAT IS OUR BUSINESS? • How do we perform it? • What are our goals?
Mission Statements The organization’s purpose for being; provides boundaries and focus • Merck –The mission of Merck is to provide society with superior products and services - innovations and solutions that improve the quality of life and satisfy customer needs - to provide employees with meaningful work and advancement opportunities and investors with a superior rate of return • Hard Rock Café –To spread the spirit of Rock ‘n’ Roll by delivering an exceptional entertainment and dining experience. We are committed to being an important, contributing member of our community and offering the Hard Rock family a fun, healthy, and nurturing work environment while ensuring our long-term success.
Mission Statements Improved examples • Otis Elevator: Our mission is to provide any customer a means of moving people and things up, down, and sideways over short distances with higher reliability than any similar enterprise in the world. • Starbucks –Establish Starbucks as the premier purveyor of the finest coffee in the world while maintaining our uncompromising principles while we grow.
Achieving the Mission • Determine competitive priorities • Identify core competencies • Define competitive qualifiers, winners, and differentiators • Develop processes to achieve strategies • Attention to the product life cycle.
Corporate Strategy • environmental scanning • core competencies • core processes • global strategies • Market analysis • segmentation • needs analysis • Competitive priorities • cost • quality • time • flexibility Developing Competitive Priorities
Corporate Strategy • environmental scanning • core competencies • core processes • global strategies • Market analysis • segmentation • needs analysis • Competitive priorities • cost • quality • time • flexibility Core Competencies The unique resources and strengths that an organization’s management considers when formulating strategy • Workforce – well trained and flexible • Facilities – well located and flexible • Market and financial know-how • Systems and technology expertise Developed over time, difficult for competitors to copy
Corporate Strategy • environmental scanning • core competencies • core processes • global strategies • Market analysis • segmentation • needs analysis • Competitive priorities • cost • quality • time • flexibility Needs Assessment Identify the needs of each segment and assess how well competitors are addressing those needs • Service or product needs price, quality, customization • Delivery system needs availability, convenience, courtesy, safety, accuracy, reliability, speed, dependability • Volume needs high, low, variability, predictability • Other needs reputation, technical support, geography
Corporate Strategy • environmental scanning • core competencies • core processes • global strategies • Market analysis • segmentation • needs analysis Competitive Priorities Competitive Priorities Cost 1. Low-cost operations Quality 2. Top quality 3. Consistent quality Time 4. Delivery speed 5. On-time delivery 6. Development speed Flexibility 7. Customization 8. Variety 9. Volume flexibility
Competitive Priorities Cost Quality
Competitive Priorities Time Flexibility
Supplier A Supplier B Item Conformance 99.9% pure - Meets 98% pure – Does not meet quality Delivery 3 days 2 days $20 / liter Cost $30 / liter Flexibility 100 liter minimum order 50 liter minimum order Order Qualifiers vs. Order Winners MUSTS: “Purity must be at least 99.5%” • Order Qualifiers –performance dimensions on which customers expect a minimum level of performance • Order Winners –performance dimensions that differentiate a company’s products and services from its competitors WANTS: “We want the fastest delivery, lowest cost, and…” MUST WANTS
Differentiators • Competencies that are unique or far ahead of the field no, or very few competitors. • Technological breakthroughs (HP-35) • Limited market niches • Hard drive evolution • Today’s differentiator quickly becomes tomorrow’s winner, and eventually the future qualifier.(e.g., I-Pod automobile adapters)
Corporate Strategy • environmental scanning • core competencies • core processes • global strategies • Market analysis • segmentation • needs analysis • Competitive priorities • cost • quality • time • flexibility New Service/Product Development Development Strategies • Product Variety Offering a wide assortment (Amazon.com, Wal-Mart) • Design Aesthetic appeal, features (Apple, Nordstroms) • Innovation Translate new technology into new products (Intel, Callaway) • Service Complementing products with services (tech support, consulting) • Market positionLeader, middle of the road, laggard
Corporate Strategy • environmental scanning • core competencies • core processes • global strategies Operations strategy • Market analysis • segmentation • needs analysis Services Manufacturing • Customized services • Assemble-to-order • Standardized services • Make-to-order • Assemble-to-order • Make-to-stock • Competitive priorities • cost • quality • time • flexibility New Service/Product Development Operations Strategy • Process decisions • Quality decisions • Capacity, location, and layout decisions • Operating decisions Operations Strategy
Service Strategies Manufacturing Strategies Customized Services Individualized servicese.g. Health clinic Make to Order (MTO) Receive order before producing goods e.g. Machine shop Assemble to Order (ATO) Assemble standardized offerings for a specific customer’s needse.g. Cellular phone service Assemble to Order (ATO) Stock standardized components/assemblies assemble finished product to customer order e.g. Dell Computer Standardized Services High volume with little varietye.g. U.S. Postal Service Make to Stock (MTS) Satisfy customer orders from inventory e.g. Paper Production and Inventory Strategy
Differentiation (Better) Response (Faster) Cost leadership (Cheaper) Generic Operations Strategies(Goals) Differentiation – better / unique Cost leadership – cheaper / value Quick response – faster
Volume (Forecast,estimates) Resources (MPS, MRP, BOM) Operating costs (Aggregate plan) Generic Operations Strategies(Inputs and Plans) • Expected volume • (Assignment I) • Operating costs • (Assignment II) • Resources • (Assignment III)
Strategy Linkages / Alignment All functional strategies must be aligned to support the business strategy… Business strategy for low cost: Financial strategy to minimize capital investment Operations strategy to increase investment for higher productivity Business strategy for superior customer support: Marketing strategy for differentiation / customization Operations strategy to build to stock for improved delivery
Corporate Strategy Market analysis • Competitive priorities • cost • quality • time • flexibility New Service/Product Development no yes CompetitiveCapabilities Operations Strategy PerformanceGap? Matching Capabilities to Priorities