Download

1 / 14
140 likes | 228 Views
enrollment.mst.edu. 2010 New Student Profile. Founded 1870 | Rolla, Missouri. Freshman Class Fall 2010 . 1,170 new first-time freshmen 388 new transfer students 32 states represented Massachusetts to California, Alaska to Florida +18 foreign countries represented

E N D
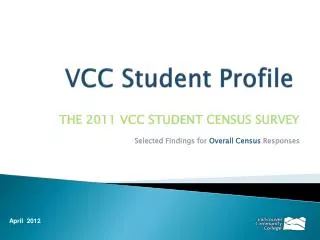
enrollment.mst.edu 2010 New Student Profile Founded 1870 | Rolla, Missouri
Freshman ClassFall 2010 • 1,170 new first-time freshmen • 388 new transfer students • 32 states represented Massachusetts to California, Alaska to Florida • +18 foreign countries represented • Ave. ACT: 27.7 upper 10% in nation, four perfect ACT & one SAT scores • Ave. HS GPA: 3.80 94% have a 3.5 GPA or higher • 38% from upper 10% of high school class • 85% from upper 30% of high school class • 86 Valedictorians and Salutatorians 16.5% from non-ranking schools Unofficial data provided for internal university planning and training - NOT FOR PUBLIC DISTRIBUTION Official S&T enrollment data available until after 4th week census
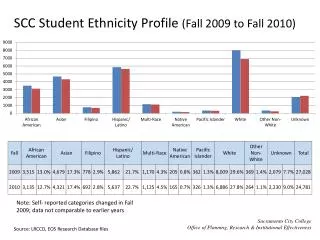
New Undergraduate Classes 60% Growth Since Fall 2000 Unofficial data provided for internal university planning and training - NOT FOR PUBLIC DISTRIBUTION Official S&T enrollment data available until after 4th week census
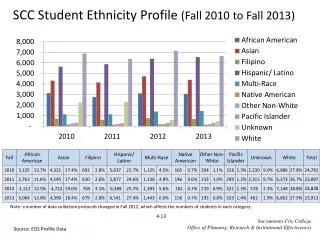
7,000 in 2010 not the same 7,000 from 1981 Fall 1981 Total Students: 7480 On-campus: 7039 Distance/EEC: 441 Undergraduate: 6313 Freshmen: 1488 Graduate: 1167 Fall 2010 Total Students: 7206 On-campus: 6520 Distance/EEC: 686 Undergraduate: 5504 Freshmen: 1170 Graduate: 1702 Fall 2000 Total Students: 4626 On-campus: 4393 Distance/EEC: 233 Undergraduate: 3698 Freshmen: 696 Graduate: 928
2010 Freshman Class Demographics • Women (24%) • Men (76%) • 80% Missouri • 19% out-of-state • 1% international • +11% minority students • +7% underrepresented minority studentsAmerican Indian, Hispanic/Latino, African American • 27% first-generation college students • 18 years old: ave. age Unofficial data provided for internal university planning and training - NOT FOR PUBLIC DISTRIBUTION Official S&T enrollment data available until after 4th week census
Activities • 95% plan to join a student organization • 54% would like to assume a student leadership position • 43% would like to study abroad (international experience) • 73% plan to be involved in recreational athletic activities • 70% plan to be involved in student design teams • 38% plan to join a fraternity or sorority • 79% interested in academic or pre-professional organizations • 51% plan to join a service or volunteer organization • 25% plan to be involved in religious based organizations • 30% plan to be involved in music and theatre • 23% plan to join a cultural or special interest group SOURCE: 2010 S&T New Student Survey & S&T PeopleSoft Student Data Modules
Decision Factors • 78% Missouri S&T: 1st choice college to attend • 16% 2nd choice college to attend • 98% chose S&T because of its quality academic reputation • 81% the personalized attention they received from S&T was important in deciding to enroll • 79% Financial Aid/scholarship was important in deciding to enroll • 71% the campus visit & tour was important in deciding to enroll • 32% became interested in S&T prior to their Jr/Sr high school year • 59% first learned of S&T from family and friends • 24% attended a Missouri S&T summer camp SOURCE: 2010 S&T New Student Survey & S&T PeopleSoft Student Data Modules
Expectations • 64% plan to complete a B.S. in 4 years or less • 91% plan to co-op or intern • 46% plan to study more than 11 hours per week at S&T • 85% studied less than 5 hours per week in high school • 92% plan to earn a 3.0 or higher S&T GPA • 46% plan to earn a 3.5 or higher S&T GPA • 41% plan to earn a graduate degree at S&T • 56% are likely to complete a graduate degree SOURCE: 2010 S&T New Student Survey & S&T PeopleSoft Student Data Modules
Financial Issues • +80% are receiving scholarships & financial aid • 22% qualify for low income Pell Grants (2009) • 81% plan to work while enrolled at S&T • 26% have/carry a credit card • 7 already have a monthly balance over $1000 SOURCE: 2010 S&T New Student Survey & S&T PeopleSoft Student Data Modules
S&T Affordability • Current Undergraduate Students (2010) • Average parent income: $ 83,500 • Family incomes below $45,000: 21% • First generation college students: 27% • Pell Grant eligible students: 22% • Graduation Statistics • Approximate indebtedness (2009): $ 23,500 • Average 2010 starting salary: $ 57,800 SOURCE: 2009 S&T PeopleSoft Student FINAID Data Modules & DOE
Technology • 97% plan to bring a PC to campus • 70% will be new computers • 79% laptops • 11% Macintosh/Apple • 99% plan to bring a cell phone to campus • 88% use online social networks (Facebook, MySpace, Twitter) • 20% spend more than 11 hours per week video gaming • 24% spend more than 15 hours per week on the internet SOURCE: 2010 S&T New Student Survey & S&T PeopleSoft Student Data Modules
Reported Starting Salaries at Commencement UndergraduateGraduate 2003 $ 47,305 $ 52,744 2004 $ 46,567 $ 52,945 2005 $ 49,181 $ 53,042 2006 $ 51,059 $ 58,120 2007 $ 53,669 $ 62,751 2008 $ 55,975 $ 63,640 2009 $ 57,521 $ 67,567 2010 $ 57,800 $ 64,243 SOURCE: S&T COC Graduating Student Survey
32 States & 14 Foreign Countries Represented in 2010 New Student Class Alaska Alabama Arkansas California Colorado Florida Georgia Iowa Idaho Illinois Indiana Kansas Kentucky Massachusetts Maryland Michigan Minnesota Missouri Mississippi North Carolina Nebraska New Mexico New York Ohio Oklahoma Pennsylvania South Carolina Tennessee Texas Virginia Vermont Wisconsin Botswana China India Kuwait Libya Malaysia Nepal Saudi Arabia Pakistan Sri Lanka Taiwan Turkey Unofficial data provided for internal university planning and training - NOT FOR PUBLIC DISTRIBUTION Official S&T enrollment data available until after 4th week census
2010 Top Feeder Schools Rolla Senior High School – 33 Francis Howell North – 21 Marquette High School – 18 Home Schooled – 16 Oakville High School – 15 Waynesville High School – 14 Wentzville Timberland High School – 14 Jefferson City High School – 13 Francis Howell High School – 13 Eureka High School – 12 Lafayette High School – 11 Camdenton High School – 10 Fort Zumwalt High School-South – 10 DeSmet High School – 10 Edwardsville (IL) High School – 10 Lindbergh High School – 10 Hazelwood West High School – 10 Troy High School – 10 Blue Springs South High School – 9 Fort Zumwalt High School-West – 9 John F. Hodge High School – 9 Pacific High School – 9 Rockwood Summit High School – 9 St. Dominic High School – 9 Seckman High School – 9 Blue Springs High School – 8 Parkway South High School – 8 Francis Howell Central – 8 Ladue Horton Watkins High School – 8 St. Louis University High School – 8 Affton High School – 7 Christian Brothers College High School – 7 Wentzville High School – 7 Hazelwood Central High School – 7 Lee Summit North High School – 7 Parkway West High School - 7 Unofficial data provided for internal university planning and training - NOT FOR PUBLIC DISTRIBUTION Official S&T enrollment data available until after 4th week census