Download
1 / 16
160 likes | 243 Views
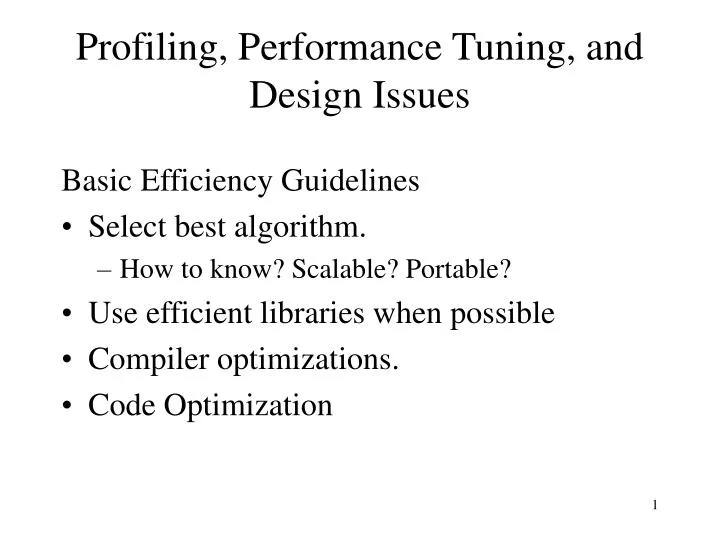
Profiling, Performance Tuning, and Design Issues. Basic Efficiency Guidelines Select best algorithm. How to know? Scalable? Portable? Use efficient libraries when possible Compiler optimizations. Code Optimization. Compiler Options for producing the Fastest Executable.

E N D
Profiling, Performance Tuning, and Design Issues Basic Efficiency Guidelines • Select best algorithm. • How to know? Scalable? Portable? • Use efficient libraries when possible • Compiler optimizations. • Code Optimization
Compiler Options for producing the Fastest Executable • Using optimization flags when compiling can greatly reduce the runtime of an executable. • Each compiler has a different set of options for creating the fastest executable . • Often the best compiler options can only be arrived at by empirical testing and timing of your code. • A good reference for compiler flags that can be used with various architectures is the SPEC web site www.spec.org. • Read the Compiler manpages. • GNU: -O3 –ffast-math –funroll-loops
Optimizing Memory Access • Memory access more of performance bottleneck than processor speed • Largest potential for performance improvement • Access data to minimize out-of-cache memory use
Memory Latencies • CPU register: 0 cycles • L1 cache hit: 2-3 cycles • L1 cache miss satisfied by L2 cache hit: 8-12 cycles • L2 cache miss satisfied from main memory, no TLB miss: 75-250 cycles • TLB miss requiring only reload of the TLB: ~2000 cycles • TLB miss requiring reload of virtual page – page fault: hundreds of millions of cycles
Other Code Optimizations • Copy Propagation • Constant Folding • Dead Code Removal • Induction Variable Simplification • Function Inlining • Loop Invariant Conditionals • Variable RenamingLoop Invariant Code Motion • Loop Fusion • Pushing Loops inside Subroutines • Loop Index Dependent Conditionals • Loop Unrolling • Loop Stride Size • Floating Point Optimizations • Faster Algorithms • External Libraries • Assembly Code • Lookup Tables
Code Optimization References • Software Optimizations for High Performance Computing by Crawford and Wadleigh • High Performance Computing by Kevin Dowd et al • Performance Optimization for Numerically Intensive Codes by Goedecker and Hoisie
Timing and Profiling Codes • Need to know where to focus attention • “Premature Optimization is the root of all evil” • Donald Knuth • The “80-20 rule” – codes generally spend 80% of their time executing 20% of their instructions • flat profile shows how much time your program spent in each function, and how many times that function was called. • call graph shows, for each function, which functions called it, which other functions it called, and how many times. • annotated source listing is a copy of the program's source code, labeled with the number of times each line of the program was executed.
GNU gprof • The first step in generating profile information for your program is to compile and link it with profiling enabled – use the `-pg' option when you run the compiler. (This is in addition to the options you normally use.) • The `-pg' option also works with a command that both compiles and links: cc -o myprog myprog.c utils.c -g -pg Execute code in normal manner ./myprog Create profile with gprof gprof myprog > myprog.prof
Profiling on the Beowulf Cluster • Compile: pgf77 -Mprof=func program.f pgcc -Mprof=func program.c • Run the code: • To produce a profile data file called pgprof.out. • View the execution profile: • pgprof pgprof.out
Pgprof (without x windows) Loading.... Datafile : pgprof.out Processes : 1 pgprof> print Time/ Function Calls Call(%) Time(%) Cost(%) Name: ------------------------------------------------------------------------ 4100500 0.00 23.43 23 lxi (cdnz3d.f:1632) 4100500 0.00 21.90 22 damping (cdnz3d.f:2319) 4100500 0.00 21.87 22 leta (cdnz3d.f:1790) 4100500 0.00 11.68 12 lzeta (cdnz3d.f:1947) 4100500 0.00 11.24 33 sum (cdnz3d.f:2107) 250 0.02 5.99 97 page (cdnz3d.f:1527) • 0.01 2.79 3 tmstep (cdnz3d.f:678) pgprof> quit
Overviewof PAPI • Performance Application Programming Interface • The purpose of the PAPI project is to design, standardize and implement a portable and efficient API to access the hardware performance monitor counters found on most modern microprocessors. • Parallel Tools Consortium project http://www.ptools.org/
PAPI Counter Interfaces • PAPI provides three interfaces to the underlying counter hardware: • The low level interface manages hardware events in user defined groups called EventSets. • The high level interface simply provides the ability to start, stop and read the counters for a specified list of events. • Graphical tools to visualize information.
Parallel Communication Profiling A significant factor that affects the performance of a parallel application is the balance between communication and workload. The challenge of the message passing model is in reducing message traffic over the interconnection network. Performance analysis tools are needed. Two such tools: VAMPIR http://www.pallas.com uses the profile extensions to MPI and permits analysis of the message events where data is transmitted between processors during execution of a parallel program. It has user-interface with zooming and filtering. PARAVER http://www.cepba.upc.es/ was developed to respond to the basic need to have a qualitative perception of the application behavior by visual inspection and then to be able to focus on the detailed quantitative analysis of the problems.