Download

1 / 26
971 likes | 2.48k Views
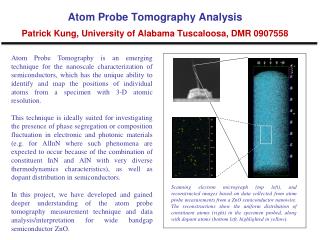
Introduction to Atom Probe Tomography. Brian P. Gorman bgorman@mines.edu Department of Metallurgical and Materials Engineering, CSM. Internal Interface Characterization. Need to know: Chemical abruptness Structural roughness (nm spatial resolution)

E N D
Introduction to Atom Probe Tomography Brian P. Gorman bgorman@mines.edu Department of Metallurgical and Materials Engineering, CSM
Internal Interface Characterization • Need to know: • Chemical abruptness • Structural roughness (nm spatial resolution) • Grain Boundary and Dopant structure (ppm chemical information in nm spaces) • How? • SIMS – nm scale chemical profiling in z-direction except with significant surface roughness, 50nm best resolution x-y, ppb detectability • TEM - Å level spatial resolution, ~1at% best chemical resolution with EDS, EELS • Atom Probe - Å level spatial resolution, 10ppm chemical resolution, data needs reconstruction
Why Atom Probe? Atom Probe
Pulsed High VoltagePulsed Laser Removes Atoms, 1 at a time Layer by Layer Atom Probe Tomography 2D Detector Determines x,y coordinates of atom Data are collected and interpreted Needle-Shaped Specimen 3-Dimensional Reconstructed Model of Specimen z is determined from sequence of evaporation events Time of Flight Determines Atom Type
Atom Probe Detectability Limits • Are there atoms in the field of view? • 100nm diameter FOV is ~100,000atoms / surface • Can we detect each atom? • Cross-wire delay line detector has ~50% collection efficiency • We then capture ~50,000 atoms / surface • Can theoretically detect one atom count above the background, or 1017 to 1018 atoms/cm3
Local Electrode Atom Probe (LEAP) • Advantages of putting the counter electrode within close proximity of the specimen • Wider field of view • Lower extraction voltages • MUCH higher acquisition rates
LEAP Data Interpretation STEM APT • FIB prepared Al specimens illustrate Ga phase segregation in STEM-HAADF • LEAP illustrates Ga segregation to GBs
APT Process • Specimen Preparation • Dependent upon material evaporation field, electrical properties, thermal properties, cost, throughput • Field Evaporation / Data Collection • Voltage vs. laser pulsing, laser power, pulse fraction, base Temperature, flight path • Reconstruction and Data Analysis • Need to know evaporation field or tip shape (TEM cross correlation), many reconstruction correction algorithms, interpret mass spectrum • Data analysis takes ~3x longer than specimen preparation and collection
Specimen Preparation • Traditionally: • AP primarily used for metallurgical specimens • Electropolishing needle geometries used extensively • Currently: • Focused Ion Beam / SEM • In-situ liftout of site-specific areas • FIB used to final polish 100nm specimens
Atom Probe Specimen Preparation • Deposit a 200 nm thick Pt bar in the FIB • Dimensions: 2 microns wide, 30 – 40 microns long • Start with e-beam Pt (~50nm), then switch to ion beam to minimize Ga damage (~250nm total thickness)
Liftout – Blanket Wafers Second wedge First wedge Cantilever Attach Nanomanipulator Liftout
FIB Specimen Prep II • Site specific sample preparation – 65nm CMOS transistors Acknowledgement UFL and INTEL
Si Microtip Arrays Position sample wedge here Sample wedge Pt weld Microtip post Top-down image of microtip Side-view of LEAP microtip coupon Attach sample to wedge
Slice Sample and Retract Wedge Slice sample from wedge Remainder of wedge is retracted Wedge is aligned to the next microtip and the process is repeated
Atom Probe Liftout B. P. Gorman et al., Microsc. Today, 16 (2008) 42.
Final Sharpening • Want: 100 - 200 nm diameter, >50m long specimen • Have: ~10m2 specimen on post • Annular milling patterns used to remove outer material and leave specimen in the center Ga+
Ion-Solid Interaction Considerations: Ga into Si SRIM 2003 Simulations 30keV 0° incidence 3.7 sputtered Si / incident Ga 30keV 89° incidence 22 sputtered Si / incident Ga
Ion-Solid Interaction Considerations: Ga into Si SRIM 2003 Simulations 5keV 0° incidence 1.4 sputtered Si / incident Ga 5keV 89° incidence 7.1 sputtered Si / incident Ga
FIB Specimen Preparation and Implant Measurement • Lower FIB energy results in less Ga implantation • Ga implantation is minimal at 2kV • K. Thompson, et. al., Ultramic., 107 (2007) 131
FIB / TEM / LEAP Prep • Specimens milled directly down alpha tilt axis of TEM and in line with AP detector
Instrumentation for FIB TEM and LEAP Removable Tip Grid Holder
APT Designs • Straight flight path (LEAP 4000 XSi) • Highest field of view (>200 nm diameter), repetition rate (1 MHz laser pulse), detection efficiency (~57%) • Lower mass resolution • Reflectron – energy compensated (LEAP 4000 XHR) • Highest mass resolution • Slightly lower field of view, repetition rate (250 kHz), detection efficiency (~35%) • Laser pulse vs voltage pulse
Laser Pulsed Local Electrode Atom Probe • Advantages of laser pulsing • Low electrical conductivity materials • Improved interface transitions Voltage pulse Laser pulse Eevap T