Download
1 / 12
120 likes | 219 Views
Enrollment and Credit Hour Production. Enrollment. Undergraduate. Graduate. Ratio of Fall 2002 Enrollment to Five-Year Average. Undergraduate. Ratio of Fall 2002 Enrollment to Five-Year Average. Graduate. Definitions. Instructional FTE – Permanent or temporary faculty paid from 1310 lines

E N D
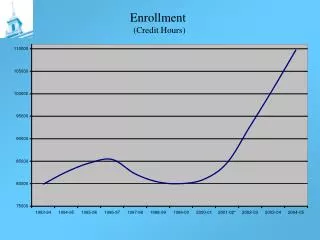
Enrollment Undergraduate Graduate
Ratio of Fall 2002 Enrollment to Five-Year Average Undergraduate
Definitions • Instructional FTE – Permanent or temporary faculty paid from 1310 lines • Supplemental FTE – All others teaching a class • Student Credit Hours and FTE are based on the home department of the instructor • Sections are based on total number of course and laboratory sections listed by Registration and Records
Number of Instructional FTEFor the 98-99 Through 02-03 Academic Years CALS NC State
Number of Supplemental FTEFor the 98-99 Through 02-03 Academic Years CALS NC State
Instructional and Supplemental FTE in CALS 18 % 24 % 24 % 22 % 22 % Academic Year
Number of Student Credit HoursCollege of Agriculture and Life Sciences Academic Year
Number of Sections Offered College of Agriculture and Life Sciences Academic Year
Student Credit Hours Generated Per FTE Academic Year
Ratio of SCH Generated per FTE Compared to CALS Average (02-03 AY)