Download
1 / 15
150 likes | 252 Views
Wind Energy. Sam Hubbard 24 th February 2005. The Current Situation. The UK presently has an installed capacity of 888.8 MW Both onshore and offshore installations Wind energy is the third largest contributor to renewable energy supply

E N D
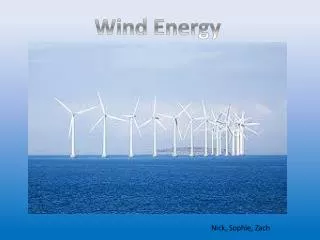
Wind Energy Sam Hubbard 24th February 2005
The Current Situation • The UK presently has an installed capacity of 888.8 MW • Both onshore and offshore installations • Wind energy is the third largest contributor to renewable energy supply • Presently supplies 0.3% of the total UK’s energy supply
Benefits of Wind Energy • Renewable • UK has one of the best resources of wind in Europe • Clean, emission free energy • Economy Friendly
Limitations And Implications • Visual Intrusion • Bird Strikes • Intermittency • Rotor Failure • Noise • Public Opposition and Planning Constraints
Projections • The UK presently has an installed capacity of 888.8 MW • BWEA projects a capacity of 8000 MW by 2010 • 280 MW was installed in 2004 • With Onshore and offshore developments in future more MW per year will be installed
2,000 1,500 MW Capacity 1,000 500 0 2000 2001 2002 2003 2004 2005 2006 2007 2008 2009 2010 2011 2012 2013 2014 2015 2016 2017 2018 2019 2020 2021 2022 2023 2024 2025 2026 2027 2028 2029 2030 1998 1999 Year If Trends Continue This is incredibly unlikely
Scenario 3 • Installation Rates remain the same
Projections • By 2010 a capacity of 6688.8MW • By 2015 a capacity of 10888.8MW • By 2020 a capacity of 12848.8MW • By 2025 a capacity of 13363.8MW • By 2030 a capacity of 13646.8MW
Generation Capability • By 2010, 63.3 PJ • By 2015 103.0 PJ • By 2020 121.6 PJ • By 2025 126.4 PJ • By 2030 129.1 PJ
Conclusions • Wind Energy is clean effective form of energy to contribute to the energy mix • Development is likely to level of after 2010 • Depends On Technology Advances • Cannot be developed over 15% of total mix
Acknowledgements/References • DTI Renewables • BWEA • E on UK • Country Guardian • Boyle et al. Energy for a Sustainable Future • Video intro courtesy of BWEA