Download

1 / 10
110 likes | 228 Views
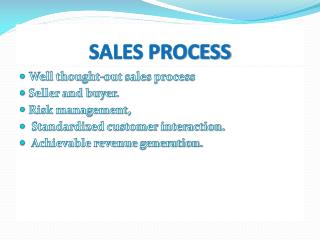
Alternatives to Sales Budgeting Process. Sales budget. Production budget. Revenue budget. Sales and administrative expense budget. Direct labor materials and overhead budgets. Cost of goods sold budget. Budgeted profit and loss statement. Sales forecasts.

E N D
Sales budget Production budget Revenue budget Sales and administrative expense budget Direct labor materials and overhead budgets Cost of goods sold budget Budgeted profit and loss statement Sales forecasts Impact of Sales Forecasts on Budgeting
50 40 Percent rate of change forecast Unit rate of change forecast Naïve forecast Moving average forecast 30 Sales 20 10 1 2 3 4 5 0 Time Period Figure 7-2:Comparing Trend Forecasting Methods
90 80 3.6 Sales 70 Y = 63.9 + 3.5 X 63.9 60 0 1 2 3 4 5 6 50 Fitting a Trend Regression to Seasonally Adjusted Sales Data Time Period
Time Periods 1 2 3 4 5 6 Actual sales 49 77 90 79 57 98 Seasonally adjusted sales 67 68 78 81 78 87 Two-period moving average forecast seasonally corrected 78.3 70.1 58.0 89.8 Three-period moving average forecast seasonally corrected 68.9 55.2 89.3 Two-period moving average forecast Three-period moving average forecast F3 = ( S1 + S2 ) x I3 F4 = ( S1 + S2 + S3 ) x I4 2 3 = ( 67 + 68 ) x 1.16 = 78.3 = ( 67 + 68 + 78 ) x 0.97 = 68.9 2 3 Forecasting with Moving Averages
Market potential Relations Among Market Potential, Industry Sales, and Company Sales Industry forecast Basic demand gap Industry Sales Company potential Company forecast Company demand gap Actual Forecast 1 2 3 4 5 6 7 8 9 10 11 12 Custom time period
Percentage Percentage of of Firms Percentage of Firms that That Use Firms No Methods Use Regularly Occasionally Longer Used Subjective Sales force composite 44.8% 17.2% 13.4% Jury of executive opinion 37.3 22.4 8.2 Intention to buy survey 16.4 10.4 18.7 Extrapolation Naïve 30.6 20.1 9.0 Moving Average 20.9 10.4 15.7 Percent rate of change 19.4 13.4 14.2 Leading indicators 18.7 17.2 11.2 Unit rate of change 15.7 9.7 18.7 Exponential smoothing 11.2 11.9 19.4 Line extension 6.0 13.4 20.9 Quantitative Multiple regressing 12.7 9.0 20.9 Econometric 11.9 9.0 19.4 Simple regression 6.0 13.4 20.1 Box-Jenkins 3.7 5.2 26.9 Utilization of Sales Forecasting Methods of 134 Firms
2001 Effective 2001 Total Buying Income Retail Sales Total Population Percentage Percentage Percentage Buying Amount of United Amount of United Amount of United Power ($000,000) States ($000,000) States (000) States Index Total United States $4,436,178 100.0% $2,241,319 100.0% 262,313 100.0% 100.0 Sacramento Metro 25,572 0.5764% 12,414 0.5538% 1,482 0.5653% 0.5674 Data Used to Calculate Buying Power Index
(1) (2) Production Number of Machines Market NAIC Employees Used per 1000 Potential Code Industry (1000) Workers (1 x 2) 204 Grain milling 2.3 8 18.4 205 Bakery Products 11.9 10 119.0 208 Beverages 1.9 2 3.8 141.2 Estimating the Market Potential for Food Machinery in North Carolina
Four-year Quarterly Seasonal Quarter 1 2 3 4 Average Index 1 49 57 53 73 58.0 0.73 2 77 98 85 100 90.0 1.13 3 90 89 92 98 92.3 1.16 4 79 62 88 78 76.8 0.97 Four-year sales of 1268/16 = 79.25 average quarterly sales Year Calculating a Seasonal Index from Historical Sales Data