Download
1 / 50
500 likes | 622 Views
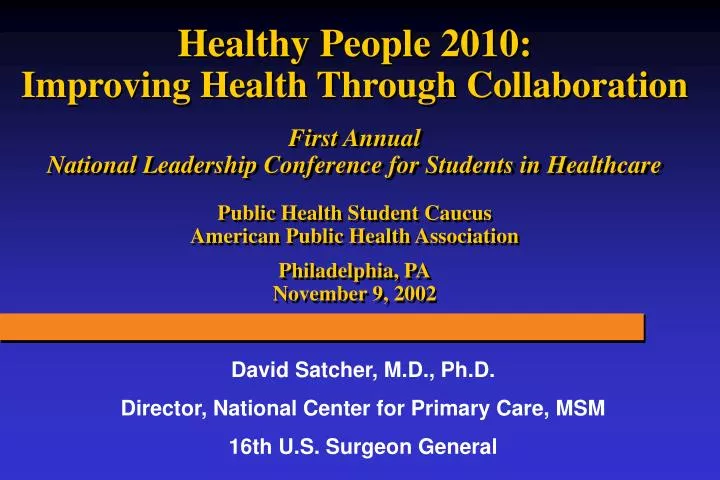
Healthy People 2010: Improving Health Through Collaboration First Annual National Leadership Conference for Students in Healthcare Public Health Student Caucus American Public Health Association Philadelphia, PA November 9, 2002. David Satcher, M.D., Ph.D.

E N D
Healthy People 2010: Improving Health Through Collaboration First Annual National Leadership Conference for Students in Healthcare Public Health Student Caucus American Public Health Association Philadelphia, PA November 9, 2002 David Satcher, M.D., Ph.D. Director, National Center for Primary Care, MSM 16th U.S. Surgeon General
Purpose of Lecture • Offer the national prescription for building the next generation of Healthy People • Discuss the important role Surgeon General’s Reports have played in the nation’s health • Provide an overview of Healthy People 2010, its two major goals, and the 10 Leading Health Indicators and analyze their role in improving the nation’s health • Discuss the challenges to and opportunities for protecting and advancing health
Healthy People 2010: Entering its third decade 1979 - Surgeon General’s Report on Health Promotion and Disease Prevention 1980 - Promoting Health/Preventing Disease: Objectives of the Nation 1980 - Healthy People 1990 1990 - Healthy People 2000 2000 - Healthy People 2010
What is Healthy People? • A comprehensive set of national 10-year health objectives • Developed by a collaborative process • Designed to measure progress over time • A public health document that is part strategic plan, part national health data report, and part textbook on public health priorities
Healthy People 2010’s Format • 2 over-arching goals • 28 focus areas (chapters) • 467 specific objectives • 10 Leading Health Indicators
Healthy People 2010 GoalsOverarching Goals • Increase Years and Quality of • Healthy Life • Eliminate Racial and Ethnic Health • Disparities
Goal #1: Increase Years and Quality of Healthy Life We must look at health across the lifespan, beginning in early childhood all the way through the latter years.
Major Questions on Increasing Years and Quality of Life • What is successful aging? • What are the major diseases of aging? • How do we prevent or delay the onset of degenerative diseases? • What changes in American society are needed to facilitate successful aging?
Goal #2: Eliminate Racial and Ethnic Disparities in Health Despite notable progress in the overall health of the nation, health disparities exist among various racial/ethnic groups, as pointed out in recent SG Reports.
U.S. Race and Health Initiative Six Initial Areas of Focus • Infant Mortality • Breast and Cervical Cancer • Cardiovascular Disease • Diabetes • Immunizations • HIV/AIDS
Lifestyle Physical activity Overweight and obesity Tobacco use Substance abuse Responsible sexual behavior Health Systems Access to care Mental health Injury and violence Environmental quality Immunization Leading Health Indicators Ten Major Public Health Issues
Health System Indicators • Access to Care • Mental Health • Injury and Violence Prevention • Environmental Quality • Immunization
Access to Health Care Major Barriers • Uninsured • Underinsured • Underserved • Underrepresented • Uninspired • Untrusting • Uninformed
Percent distribution of total population and the uninsured by race/ethnicity: People under age 65, first half of 1999 • Although nearly 70% of non-elderly Americans were White, Whites accounted for only 55% of uninsured people. • Hispanics and African-Americans were disproportionately represented among the uninsured. total uninsured Source: AHRQ 1999 Medical Expenditure Panel Survey Household Component
Mental Health Report Overcome the stigma Reduce the financial barriers to treatment Increase public awareness of effective treatments Ensure the delivery of state-of-the- art treatments Tailor treatments to age, gender, race and culture Ensure the supply of mental health services and providers Continue building the science base
Environmental Quality • Major Concerns • Safe environments for walking/physical activity • Environments safe from threats of bioterrorism • Safe living environments: African-American and Hispanic children are much more likely to grow • up near hazardous waste sites than majority • children • 25% of preventable illnesses worldwide • are due to poor environmental quality
Lifestyle Indicators and the Surgeon General’s Rx Lifestyle • Physical Activity • Overweight & Obesity • Tobacco Use • Substance Abuse • Responsible Sexual Behavior
Lower risk of death for adults of any age Decrease risk of many types of cancer, including breast, prostate, and colon cancer Reduce deaths from cardio- vascular disease by 50% Reduce the onset of Type II diabetes by 56% Decrease body fat Physical Activity Health Impact • Prevent and lower high blood pressure • Increase muscle tone and fitness • Increase bone strength • Enhances sexual potency and enjoyment • Reduce stress and enhance overall psychological well being
Physical Activity • Adults • < 1/3 engage in regular physical activity • 40% report no leisure time physical activity Adolescents • 43% watch TV > 2 hours each day • Only 25% take recommended PE
Physical Activity & Mental Health Health Impact Studies show that physical activity reduces depression & elevates mood. Studies show that physical activity improves sleeping. Studies show that physical activity improves mental acuity. Studies show that physical activity reduces stress and anxiety.
Physical activity and good nutrition combined can save many lives each year -- over 300,000 of the premature deaths that occur in this country every year are the result of physical inactivity and poor nutrition,combined with a few other things. The A-B-C’s of the Dietary Guidelines for All Americans
Nutrition Only 3% of all individuals meet four of the five recommendations for the intake of grains, fruits, vegetables, dairy products, and meats.
Higher body weights are associated with higher death rates Increased risk of high blood pressure, elevated cholesterol, Type 2 diabetes, heart disease and stroke, gallbladder disease, arthritis, sleep disturbances and problems breathing Increased risk of hip fractures, endometrial, breast, prostate and colon cancers Social stigmatization, discrimination, and lowered self-esteem Overweight and Obesity Health Impact
Thirteen percent of children ages 6-11 and 14 percent of adolescents ages 12-19 are overweight. During the past two decades, the percentage of children who are overweight has nearly doubled (from 7 to 13 percent). Current evidence suggests childhood overweight/obesity continue to adulthood. Studies have shown that physical activity can positively affect grade scores, alertness, energy level, and may enhance brain function and mood and that participation in school breakfast is positively associated with better test scores, better grades, better attention, and better behavior. Overweight and Obesity Children and Adolescents
Body Mass Index BMI = Weight (kg)/height squared (m2) Definitions Overweight = 25-29.9 kg/m2 Obesity = 30 kg/m2
No Data <10% 10%-14% 15-19% 20% Source: Mokdad AH. Obesity Trends* Among U.S. AdultsBRFSS, 1990 (*BMI 30, or ~ 30 lbs overweight for 5’4” woman)
No Data <10% 10%-14% 15-19% 20% Source: Mokdad AH. Obesity Trends* Among U.S. AdultsBRFSS, 1991 (*BMI 30, or ~ 30 lbs overweight for 5’4” woman)
No Data <10% 10%-14% 15-19% 20% Source: Mokdad AH. Obesity Trends* Among U.S. AdultsBRFSS, 1992 (*BMI 30, or ~ 30 lbs overweight for 5’4” woman)
No Data <10% 10%-14% 15-19% 20% Source: Mokdad AH. Obesity Trends* Among U.S. AdultsBRFSS, 1993 (*BMI 30, or ~ 30 lbs overweight for 5’4” woman)
No Data <10% 10%-14% 15-19% 20% Source: Mokdad AH. Obesity Trends* Among U.S. AdultsBRFSS, 1994 (*BMI 30, or ~ 30 lbs overweight for 5’4” woman)
No Data <10% 10%-14% 15-19% 20% Source: Mokdad AH. Obesity Trends* Among U.S. AdultsBRFSS, 1995 (*BMI 30, or ~ 30 lbs overweight for 5’4” woman)
No Data <10% 10%-14% 15-19% 20% Source: Mokdad AH. Obesity Trends* Among U.S. AdultsBRFSS, 1996 (*BMI 30, or ~ 30 lbs overweight for 5’4” woman)
No Data <10% 10%-14% 15-19% 20% Source: Mokdad AH. Obesity Trends* Among U.S. AdultsBRFSS, 1997 (*BMI 30, or ~ 30 lbs overweight for 5’4” woman)
No Data <10% 10%-14% 15-19% 20% Source: Mokdad AH. Obesity Trends* Among U.S. AdultsBRFSS, 1998 (*BMI 30, or ~ 30 lbs overweight for 5’4” woman)
No Data <10% 10%-14% 15-19% 20% Source: Mokdad A H, et al. J Am Med Assoc 2000;284:13 Obesity Trends* Among U.S. AdultsBRFSS, 1999 (*BMI 30, or ~ 30 lbs overweight for 5’4” woman)
No Data <10% 10%-14% 15-19% 20% Source: Mokdad A H, et al. J Am Med Assoc 2001;286:10 Obesity Trends* Among U.S. AdultsBRFSS, 2000 (*BMI 30, or ~ 30 lbs overweight for 5’4” woman)
4% 4-6% 6% n/a Source: Mokdad et al., Diabetes Care 2000;23:1278-83 Prevalence of Diabetes among U.S. Adults BRFSS, 1993-94
4% 4-6% 6% n/a Source: Mokdad et al., Diabetes Care 2000;23:1278-83 Prevalence of Diabetes among U.S. Adults BRFSS, 1995-96
4% 4-6% 6% n/a Source: Mokdad et al., Diabetes Care 2000;23:1278-83 Prevalence of Diabetes among U.S. Adults BRFSS, 1997-98
Consequences of Childhood and Adolescent Obesity Common Uncommon • Growth • Psychosocial • Hyperlipidemia • Hepatic steatosis • Abnormal glucose metabolism • Persistence into adulthood • Hypertension • Sleep apnea • Pseudotumor • PCOD • Cholelithiasis • Orthopedic New: Increased prevalence of Type 2 diabetes
Less than Half of U.S. Adults Are a Healthy Weight 61% of Adults* are overweight or obese. OverweightObese Today 34% 27% 1970s 32% 15% *20 years or older
Total Cost of Overweight and Obesity • $117.7 billion • Direct cost = $61.3 billion • Indirect cost = $56.4 billion
Settings for Action • Families & Communities • Schools • Worksites • Health Care • Media and Communications
Harmful Lifestyle Behaviors • Tobacco use • Substance abuse • Excessive alcohol use • Poor dietary choices
STDs infect approximately 15 million persons each year, including 4 million adolescents Over 1.3 million induced abortions occurred in 1996 Nearly one-half of pregnancies are unintended An estimated 22% of women and 2% of men have been victims of a forced sexual act An estimated 104,000 children are victims of sexual abuse each year Responsible Sexual Behavior STD’s and Other Sexual Health Concerns
Abstinence when appropriate Optimal protection of self and others when sexually active What Is Responsible Sexual Behavior? Call to Action to Promote Sexual Health and Responsible Sexual Behavior Released June 2001
Points of Attack • Access to Care • Improving Quality of Care • Lifestyle Enhancement • Improving Environmental Quality • A Balanced Research Agenda
Life is filled with golden opportunities, carefully disguised as irresolvable problems. -- John Gardner former Secretary of Health, Education & Welfare
Healthy People 2010: Improving Health Through Collaboration First Annual National Leadership Conference for Students in Healthcare Public Health Student Caucus American Public Health Association Philadelphia, PA November 9, 2002 David Satcher, M.D., Ph.D. Director, National Center for Primary Care, MSM 16th U.S. Surgeon General