Download
1 / 11
130 likes | 186 Views
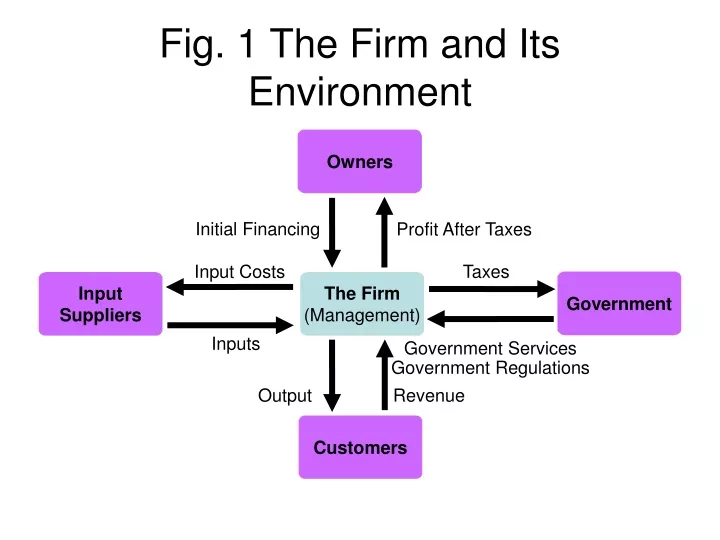
Owners. Initial Financing. Profit After Taxes. Input Costs. Taxes. Input Suppliers. The Firm (Management). Government. Inputs. Government Services Government Regulations. Output. Revenue. Customers. Fig. 1 The Firm and Its Environment. Production Function.

E N D
Owners Initial Financing Profit After Taxes Input Costs Taxes Input Suppliers The Firm (Management) Government Inputs Government Services Government Regulations Output Revenue Customers Fig. 1 The Firm and Its Environment
Production Function Fig. 2 The Firm's Production Function Alternative Input Combinations Different Quantities of Output
Units of Output Number of Workers 1 6 2 4 3 5 Fig. 3 Total and Marginal Product Total Product 196 184 161 DQ from hiring fourth worker 130 DQ from hiring third worker 90 DQ from hiring second worker 30 DQ from hiring first worker increasing marginal returns diminishing marginal returns
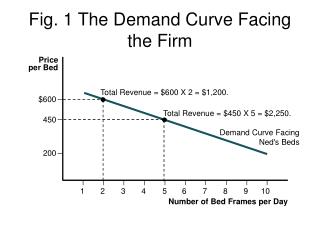
Dollars $435 375 315 255 195 135 0 30 90 130 161 184 196 Units of Output Fig. 4 The Firm's Total Cost Curves TC TVC TFC TFC
Dollars $4 3 2 1 30 90 130 161 196 0 Units of Output Fig. 5 Average and Marginal Costs MC AFC ATC AVC
Dollars $4.00 3.00 2.00 1.00 30 90 130 161 184 250 300 0 196 Units of Output Fig. 6 Long-Run Average Total Cost ATC1 LRATC ATC3 ATC0 ATC2 C D B E A 175 Use 0 automated lines Use 1 automated lines Use 2 automated lines Use 3 automated lines
Dollars $4.00 3.00 2.00 1.00 130 184 Fig. 7 The Shape of LRAC LRATC 0 Economies of Scale Constant Returns to Scale Diseconomies of Scale Units of Output
Dollars $160 80 1,000 3,000 100,000 0 Units per Month Fig. 9a A Market with Many Small Firms LRATCTypical Firm F E DMarket
Dollars $160 80 100,000 0 Units per Month Fig 9b A Natural Monopoly LRATCTypical Firm DMarket
Dollars $200 80 100,000 25,000 0 Units per Month Fig. 9c A Market with a Few Large Firms LRATCTypical Firm H F E DMarket
Dollars $160 80 1,000 10,000 100,000 0 Units per Month Fig 9d A Market with Coexisting Small and Large Firms LRATCTypical Firm E F DMarket