Download
1 / 24
380 likes | 1.31k Views
Introduction to FSL (and data analysis). FMRI Undergraduate Course (PSY 181F) FMRI Graduate Course (NBIO 381, PSY 362) Dr. Scott Huettel, Course Director . Many thanks to Chris Petty for his slides and figures. Some figures are taken from the FSL website: http://www.fmrib.ox.ac.uk/fsl/.

E N D
Introduction to FSL (and data analysis) FMRI Undergraduate Course (PSY 181F) FMRI Graduate Course (NBIO 381, PSY 362) Dr. Scott Huettel, Course Director Many thanks to Chris Petty for his slides and figures. Some figures are taken from the FSL website: http://www.fmrib.ox.ac.uk/fsl/ FMRI – Week 6 – FSL and Data Analysis Scott Huettel, Duke University
Data Analysis: Main Components • Within-subjects • Preprocessing: removal/minimization of task-independent variability • General linear model • Model specification: creating and evaluating a model for brain function • Model evaluation: testing specific hypotheses • Across-subjects • Aggregation of data to increase experimental power • Inter-group comparisons • Testing of parametric effects FMRI – Week 6 – FSL and Data Analysis Scott Huettel, Duke University
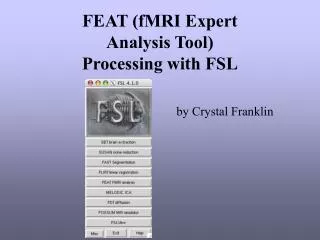
FMRIB Software Library (FSL) • Created by researchers at the FMRIB in Oxford • Comprises many tools for analysis of: • fMRI data • Structural MRI data • Diffusion Tensor Imaging data • Runs natively on Linux/Unix or Mac • Runs on Windows with virtual machine (vm-ware) • Can be run via GUI or via scripts • Citation • S.M. Smith, et al. Advances in functional and structural MR image analysis and implementation as FSL. NeuroImage, 23(S1):208-219, 2004 FMRI – Week 6 – FSL and Data Analysis Scott Huettel, Duke University
FMRIB Software Library (FSL) • FEAT: fMRI analysis (subject and group levels), preprocessing • MCFLIRT: motion correction • FLIRT: registration • BET: Brain Extraction Tool • MELODIC: independent components analysis, for model-free analyses and noise removal • FSL View: displaying data FMRI – Week 6 – FSL and Data Analysis Scott Huettel, Duke University
Preparing your data for FSL • Convert functional and anatomical data into correct format (nifti) • Generate orientation matrix for registration • Generate “3 column files” for behavior • Text files with three columns: (1) When did something happen, (2) how long did it take, (3) how much should it be weighted FMRI – Week 6 – FSL and Data Analysis Scott Huettel, Duke University
Levels of FSL analysis 1st level: session 3rd Level: group 2nd Level: subject FMRI – Week 6 – FSL and Data Analysis Scott Huettel, Duke University
1st Level: Data Parameters How many runs: -Typically do runs individually Select the 4-d data for your run Where will the data be saved? Are disdaqs already thrown out? Self explanatory FMRI – Week 6 – FSL and Data Analysis Scott Huettel, Duke University
1st Level: Preprocessing Correct for motion? Interleaved, ascending, descending, custom order Brain only voxels FMRI – Week 6 – FSL and Data Analysis Scott Huettel, Duke University
1st Level: Statistics Want to model motion? This is the only hard part (i.e., model specification) FMRI – Week 6 – FSL and Data Analysis Scott Huettel, Duke University
1st Level: General Linear Model How many explanatory variables? Select your 3 column file Shape of your correlation waveform FMRI – Week 6 – FSL and Data Analysis Scott Huettel, Duke University
1st Level: Contrasts How many zmaps? (each condition + contrasts) FMRI – Week 6 – FSL and Data Analysis Scott Huettel, Duke University
What is a contrast? • Key concept in fMRI analysis • Remember: fMRI provides relative measures • We contrast terms in our analysis model to evaluate whether they modulate the brain differently • Faces > Houses • “Tapping right hand” > “Tapping left hand” • Analogous to subtractive techniques in psychology FMRI – Week 6 – FSL and Data Analysis Scott Huettel, Duke University
FMRI – Week 6 – FSL and Data Analysis Scott Huettel, Duke University
1st Level: Thresholding Mask by a bitmap of some specified region You can mask one cope by another If Cluster: Then each cluster's estimated significance level (from GRF-theory) is compared with the cluster probability threshold. If Voxel thresholding is selected, GRF-theory-based maximum height thresholding is carried out, with thresholding at the level set, using one-tailed testing. This test is less overly-conservative than Bonferroni correction. FMRI – Week 6 – FSL and Data Analysis Scott Huettel, Duke University
1st Level: Registration Your skull stripped anatomical Click GO to run FEAT, if you need to insert the orientation matrix, then click Save FMRI – Week 6 – FSL and Data Analysis Scott Huettel, Duke University
FMRI – Week 6 – FSL and Data Analysis Scott Huettel, Duke University
2nd Level: Within-subject, across-runs Higher-level analysis – within subject Inputs are your subject’s run directories # of analyses = # of runs • Where do you want your data saved? • Individual conditions will be saved within • the output directory as separate copes FMRI – Week 6 – FSL and Data Analysis Scott Huettel, Duke University
2nd Level: Across-Runs FMRI – Week 6 – FSL and Data Analysis Scott Huettel, Duke University
FMRI – Week 6 – FSL and Data Analysis Scott Huettel, Duke University
3rd Level: Across Subjects Higher level - Group Inputs are now cope#.feat directories from the subject averages (2nd Level) #analyses = #subjects included - Select /subj#/AVG.gfeat/cope#.feat Where to save results, what name? This step needs to be done separately for every condition you are interested in viewing. FMRI – Week 6 – FSL and Data Analysis Scott Huettel, Duke University
3rd Level: Main and Parametric Effects In this example, EV1 represents the main effect across subjects. EV2 represents some parameter (e.g., a personality test) that varies across subjects. FMRI – Week 6 – FSL and Data Analysis Scott Huettel, Duke University
3rd Level: Group Effects EV1 = include in group1 EV2 = include in group2 group1 group2 FMRI – Week 6 – FSL and Data Analysis Scott Huettel, Duke University
Much More Info on FSL FEAT Expert Guide http://www.fmrib.ox.ac.uk/fsl/feat5/detail.html FSL Course Slides http://www.fmrib.ox.ac.uk/fslcourse/ More Expert Guidance http://fsl.fmrib.ox.ac.uk/fsl/feat5/ FMRI – Week 6 – FSL and Data Analysis Scott Huettel, Duke University
Rules for Projects You will do the projects in groups of ~4, based on the time of your lab session • Safety • The project is not research! • There can be no risk to the participant. • You must behave professionally and conscientiously while running your subjects. • Simplicity and Robustness • The task must be simple and easily programmed. • The design should be simple, ideally blocked with few conditions. • Our goal is to see the effect in each of two subjects. • The project is not research! • This data cannot be presented in any other setting, nor submitted to any journal, nor used for any other class… FMRI – Week 6 – FSL and Data Analysis Scott Huettel, Duke University