Download
1 / 1
10 likes | 140 Views
Advisor: Dr . Shijie Deng For more information, contact: graham.price@gatech.edu; caro.mesa@gatech.edu. Description.

E N D
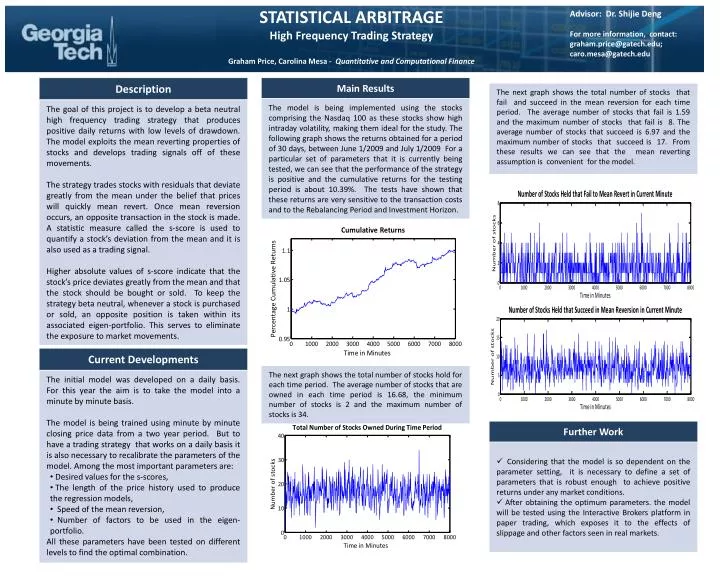
Advisor: Dr. ShijieDeng • For more information, contact: • graham.price@gatech.edu; • caro.mesa@gatech.edu Description The next graph shows the total number of stocks that fail and succeed in the mean reversion for each time period. The average number of stocks that fail is 1.59 and the maximum number of stocks that fail is 8. The average number of stocks that succeed is 6.97 and the maximum number of stocks that succeed is 17. From these results we can see that the mean reverting assumption is convenient for the model. STATISTICAL ARBITRAGEHigh Frequency Trading StrategyGraham Price, Carolina Mesa - Quantitative and Computational Finance The next graph shows the total number of stocks hold for each time period. The average number of stocks that are owned in each time period is 16.68, the minimum number of stocks is 2 and the maximum number of stocks is 34. Main Results