Download

1 / 16
160 likes | 257 Views
SAfety VEhicles using adaptive Interface Technology Phase 1 Research Program Quarterly Program Review. Task 7: Visual Distraction Harry Zhang August 12, 2003. Task Description. Team Members: Harry Zhang and Matthew Smith Objectives

E N D
SAfety VEhicles using adaptive Interface Technology Phase 1 Research ProgramQuarterly Program Review Task 7: Visual Distraction Harry Zhang August 12, 2003
Task Description • Team Members: Harry Zhang and Matthew Smith • Objectives • Identify eye glance measures that are diagnostic of visual distraction and that can be used in real-time, adaptive interface technology systems. • Determine performance (including RT) effects of visual distraction. For example, RT = f(glance duration, glance frequency, etc.). • Deliverables • A report summarizing research findings in the literature (Task 7A). • A report of experimental designs, methods, results, and recommendations from 2 simulator experiments (Task 7B). • Schedule • Literature review report (to Delphi) (7A) Completed • Team review of experimental designs (7B) Completed • IRB Approval (7B) Completed • Experiment 1 data collection (7B) Completed • Experiment 2 facility preparation and pilot testing (7B) Completed • Experiment 2 data collection (7B) In Progress • Data analysis (Exp.1 and 2) & algorithm development (7B) Sept-Nov ’03 • Final report, recommendations, Phase 2 planning (7B) Nov ’03-Jan. ‘04
Literature Review: Task 7A • Research Areas of Interest • Definition of visual distraction measures (eye glance measures) • Visual distraction and automobile crash • Major research findings • Crash predicted from measures of visual distraction • Driving performance predicted from measures of visual distraction • Reaction time predicted from measures of visual distraction • Performance effects of gaze eccentricity • Visual glance behavior during performance of conventional and navigation tasks • Effects of task complexity and display characteristics on eye glance behaviors • Effects of driving task demand on eye glance behaviors • Effects of driver age, experience and route familiarity on eye glance behaviors • Design guidelines and protocols • EU, JAMA, J2364, Alliance guidelines, CAMP workload project. • Theoretical developments • Methodology
Literature Review: Task 7A • Key Source Material • Visual distraction and automobile crash • Stutts, Reinfurt, Staplin, & Rodgman (2001); Wang, Knipling & Goodman (1996); Wierwille & Tijerina (1998) • Driving performance (inc. RT) and visual distraction (inc. gaze eccentricity) • Dingus, Hulse, McGehee, Manakkal, & Fleischman (1994) TravTek study; Green (1999); Lee, McGehee, Brown, & Reyes (2002); Osaka (1991); Summala, Nieminen, & Punto (1996); Summala, Lamble, & Maakso (1998); Tijerina (1996) truck workload study; Zwahlen & DeBald (1986). • Baseline visual glance behaviors • Dingus (1987) dissertation;Dingus, Antin, Hulse, & Wierwille (1989) ETAK study; Green (1999); Rockwell (1988) • Task/display characteristics, driving demand, and visual glance behaviors • Blanco (1999); Dingus (1987); Labiale (1996); Tijerina (1999) car-following study • Guidelines • Alliance’s Statement of Principles (2002); Green (1999); Tijerina, Johnston, Parmer, Winterbottom, & Goodman (2000); Zwahlen, Adams, & DeBald (1988) • Theory • Wierwille (1993) • Methodology • Victor, Blomberg, & Zelinsky (2001) • Needs for real-time systems • Hoedemaeker, de Ridder, & Janssen (2002); Tijerina, Johnston, Parmer, Winterbottom, & Goodman (2000)
Literature Review: Task 7A Major Findings Wierwille’s Visual Sampling Theory • For safe driving, a vast majority of visual resource (e.g., >70%) must be allocated to the forward roadway (Antin, Dingus, Hulse, & Wierwille, 1990; Coles & Hughes, 1987; Hughes & Coles, 1988). • Off-road glance duration is typically 1-1.5 s (Kurokawa & Wierwille, 1990; Rockwell, 1988; Tijerina, 1999).
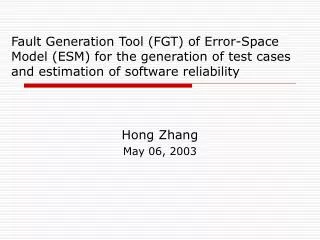
Literature Review: Task 7A Major Findings r=0.192 Wierwille and Tijerina (1998) r=0.898 # of Crash # of Crash Mean Glance Duration (s) r=0.396 # of Crash Type-1 Eyes-Off-Road Exposure # of Glances r=0.436 Type-1 eyes-off-road exposure = (mean glance duration) * (# of glances) * (frequency of use/week) # of Crash • Study Limitations • Eye glance data compiled from 3 previous studies. • Frequency of use data compiled from 3 different studies. • Number of crash obtained from North Carolina 1989 crash narratives (police reports). Frequency of Use/Week
Literature Review: Task 7AMajor Findings • SDLP increased with mean glance duration and number of Glances (Zwahlen & DeBald, 1986). • The number of lane departures and secondary task completion time Increased, travel speed decreased with the number of glances and total glance duration (see studies by Dingus; McGehee; Tijerina; Wierwille; Green; Jenness; et al.). • RT prolonged with higher levels of visual distraction (see studies by Summala; Lee; Hancock). • Off-road glance duration is usually < 2 s (the 2-second rule). However, glance duration can vary with display complexity (Rockwell, 1988; Labiale, 1996). • Glance frequency, total off-road glance duration, Type 1 or Type 2 eyes-off-road exposure increase with task/display complexity, message length, information density (Blanco, 1999; Dingus, 1987; Dingus, Wierwille, et al., 1988; Labiale, 1996). • Visual behaviors vary based on the driving task demand as represented in terms of measures such as road curvature (Tsimhoni, Green, et al. 2001, 2002), crosswind (Kurokawa & Wierwille, 1990 ), traffic density (Wierwille et al., 1988, 1993), and driving scenarios (e.g., whether or not following a lead vehicle, Tijerina, 1999). • Visual behaviors are affected by driver age, experience, familiarity with the route (Mourant & Rockwell, 1970; studies by Wierwille; Dingus; Green; Tijerina; et al.) • Much discussion took place on appropriate thresholds for glance duration and frequency. Recommendations varied from 4 to 10 glances, from 1.2 s to 2 s for mean glance duration, and from 2 to 2.5 s for peak glance duration per task. • Performance (including lane keeping and RT) is degraded as gaze eccentricity increases (Faerber & Ripper, 1991; Summala, et al., 1996, 1999). • A common visual distraction task is reading text. Drivers typically read 2 words/s. Mean glance duration and the # of glances increase with text length (Labiale, 1996). • Facelab ETS from Seeing Machines is a good research tool for reliable measurements of head and eye movements (Victor et al., 2001).
Literature Review: Task 7A • Summary/Hypotheses • Visual distraction (# of off-road glances and glance duration; gaze eccentricity) degrades driving performance as measured in terms of SDLP, number of lane departures, task completion time, or reaction time. • Visual distraction increases the likelihood of crashes. • Measures of visual distraction include • Peak glance duration • Mean glance duration • Glance frequency (number of glances) • Total glance duration • Mean time between glances • Type 1 eyes-off-road exposure • Type 2 eyes-off-road exposure • Other combinations of glance duration and glance frequency • Most studies in the literature studied eye glance behaviors on a task basis (e.g., radio tuning). For SAVE-IT, however, time-based eye glance behaviors should be more useful. • Most studies in the literature did not use an automatic eye tracking system to measure eye glance behaviors on-line and in real time. Real-time measurement, however, is critical to SAVE-IT.
Research: Task 7B • Research Objectives • Determine diagnostic measures of visual distraction. • Operationally define the concept of visual distraction. • Measures should be time-based rather than task-based. • Use automatic eye tracking systems for real-time measurement. • Determine performance (inc. RT) impact of visual distraction, for example, RT as a function of mean glance duration and glance frequency. • This research is critical to adaptive interface technology systems including distraction mitigation and safety warning countermeasure systems. • Methods • 2 simulator experiments will be performed • Experiment 1 • Lead vehicle may brake at random points (most realistic situation). • Critical to determine performance impact of visual distraction, especially, RTV = f(eye glance measures over a time interval). • Experiment 2 • Lead vehicle may brake when subjects look away from the road. • Critical to determine performance impact of momentary off-road glances, for example, RTV = f(off-road glance duration at the moment of LV braking).
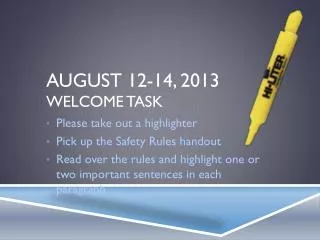
Research: Task 7BExp. 1: Facilities and Apparatus Delphi-Delco Driving Simulator Seeing Machines ETS • Non-intrusive. • Stereo-vision based. • Gaze accuracy: +/- 30. • Sampling rate: 60 Hz. • Output include: • Head position/orientation • Gaze coordinates • Blinks and eye closures • From GlobalSim, Inc. • 1 forward channel: 500 (H), 400 (V). • Can simulate a wide range of testing scenarios (e.g., lead vehicle following). • Measure performance (inc. RT). IVIS (From NEXIQ Technologies) • Sync Seeing Machines ETS data and Driving Simulator data. • Display rows of words to create visual distraction.
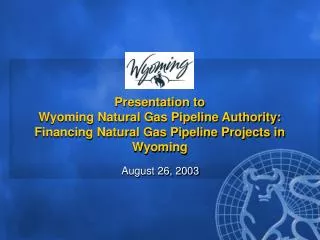
Research: Task 7BExp. 1: Independent Variables • Road Type: Rural Roads vs. Freeways • Rural Road: 2-lane, 4-mile-long loop (with straight & curved roads), lead and host vehicles on right lane, light traffic on oncoming lane, target speed = 45 MPH. • Freeway: 6-lane with median, 6-mile-long loop (with straight & curved roads), lead and host vehicles on right lane, moderate traffic on adjacent lanes, target speed = 65 MPH. • Visual Distraction: Distraction Levels and Display Eccentricity • 7 Conditions: Subjects read out loud words on a display • Condition 1: Baseline (no visual distraction introduced) • Conditions 2-5: Four levels of distraction on the center-stack display. • Condition 6: Moderately high level of distraction on the dashboard display. • Condition 7: Moderately high level of distraction on the side display. Facelab Camera Forward Screen Side Display (75° H, 2° V) Dashboard Display (-22° H, -7° V) Center Stack Display (-33° H, -28° V)
Research: Task 7BExp. 1: Independent Variables Condition 3 (3 words/row) Condition 2 (2 words/row) Ginger Effect Village Manual Impair Unique Headway Water Team Average Boost Study Recent Merge Fatigue Condition 5 (5 words/row) Conditions 4, 6, and 7 (4 words/row) Freedom Glossy Dozen Honor Loud Hazard Reject Typical Volume General Formal Expert Facility Enter Stress Tense Motivate Effect Island Feedback Prompt Name People Senate Vertical Left Laboratory • Reading is a reasonable task of visual distraction (Labiale, 1996) because it is effortless and involves little cognitive thinking (MacLeod, 1991; Stroop, 1935/1992). • Used Gestalt principle (wide separation between rows) and varied number of words per row to encourage chunking of eye glances by rows in order to manipulate both glance duration and glance frequency across conditions. • Characters: Sans Serif, mixed upper and lower cases (22’ upper cases, 17’ lower cases) • One display every 13 second, with beeps as alerts.
Research: Task 7BExp. 1: Dependent Variables • Variables that are common across SAVE-IT experiments • Brake reaction time • Foot-off-accelerator reaction time • Steering reaction time • Steering entropy • Additional variables • SDLP, mean lane position • Lane departures: Number and duration • Crashes: Number and Severity • Steering SD, mean steering • Speed SD, mean speed • Secondary task: accuracy and completion time • Head and eye movement measures such as • Eye gaze (XY) coordinates • Peak glance duration • Mean glance duration • Glance frequency • Total glance duration, and • Time-based combinations of eye glance measures • Head orientations (XYZ coordinates) • Blinks, eye closures
Research: Task 7BExp. 1: Method Lead Vehicle Following • Subjects asked to follow a lead vehicle that travels about 45 (rural roads) or 65 mph (freeways). • Subjects asked to drive at 45 (rural roads) or 65 mph (freeways). • Subjects asked to read out loud words on a display. • Lead vehicle may brake non-imminently (e.g., 0.2 g on rural roads or 0.27 g on freeway for 5 s) (Lee et al., 2001). • Braking is infrequent and similar to lead vehicle braking and slowing down in actual driving. • Time headway fixed at 1.8 s at the moment of lead vehicle braking using a “rubber band” idea. Lead Vehicle Host Vehicle
Research: Task 7BExp. 1: Subjects and Design • Used within-subjects design • 14 subjects, 7 male and 7 female • Intended: 35-55 years old; Actual: 35-53 years old (mean=43.86, SD=5.36). • With 20/40 vision or better (using the Snellen Eye Chart) • 2 Road types and 7 visual distraction conditions balanced across 14 subjects • Half of subjects ran rural roads first and the other half ran freeways first. • Latin Squares used to balance 7 visual distraction conditions. • 3 braking events per block • 2 on straight roads, 1 on a curve • Braking no more frequent than 1 per minute • Filler braking events included to introduce unpredictability • Exp. 1 just completed • Experimenter’s observations indicated/suggested • The design, ETS and simulator worked well. • Time headway at braking was usually 1.8 s (as expected). • Off-road glances increased with increasing number of words to be read. • Driving performance varied with visual distraction. • Data analysis will start in September
Research: Task 7B:Exp. 2 • Experiment 2 mainly designed to determine performance impact of momentary off-road glances, for example, RTV = f(off-road glance duration at the moment of LV braking). • Major Change: Lead vehicle braking is tied to off-road glances. • Method: Identical to Exp. 1 with the following changes • Condition 5 (5 words/row) replaced by another condition (1 word/row). • Condition 5 was very difficult for many subjects in Exp. 1. • 1 word/row is good alternative because RT seemed to “jump” from Condition 1 (no visual distraction introduced) to Condition 2 (2 words/row) in Exp. 1. • Display location in Condition 7 changed to (60° H, 2° V) to improve ETS reliability • ETS sometimes did not track in Condition 7 in Exp. 1 because of large eccentricity • Subjects instructed to start reading words as soon as the beeps are sounded. • Subjects instructed to read one row of words at a time. • Lead vehicle braking tied to off-road glances • Brake twice when eyes looking away (1.5 s after beeps) • A "filler" braking event (7 s after beeps) to introduce unpredictability • Used “minimum latency mode” for ETS • Data collection currently underway