Download
1 / 11
110 likes | 208 Views
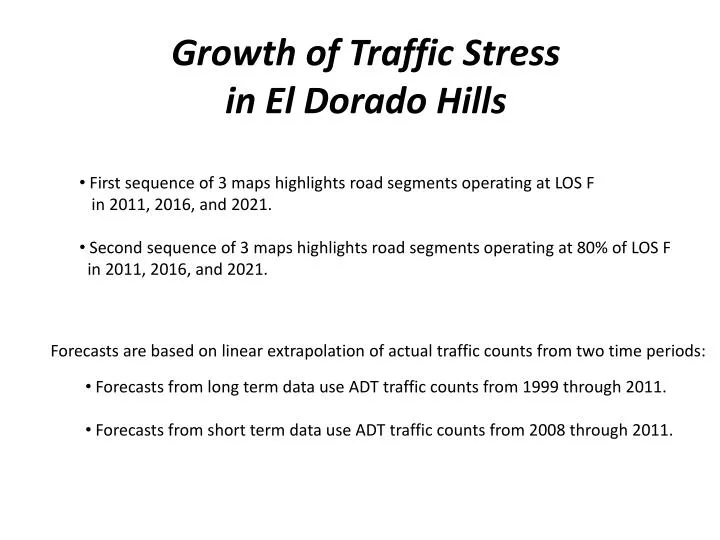
Growth of Traffic Stress in El Dorado Hills. First sequence of 3 maps highlights road segments operating at LOS F in 2011, 2016, and 2021. Second sequence of 3 maps highlights road segments operating at 80% of LOS F in 2011, 2016, and 2021.

E N D
Growth of Traffic Stressin El Dorado Hills • First sequence of 3 maps highlights road segments operating at LOS F in 2011, 2016, and 2021. • Second sequence of 3 maps highlights road segments operating at 80% of LOS F in 2011, 2016, and 2021. Forecasts are based on linear extrapolation of actual traffic counts from two time periods: • Forecasts from long term data use ADT traffic counts from 1999 through 2011. • Forecasts from short term data use ADT traffic counts from 2008 through 2011.
Sample case: History and extrapolations for a road segment currently in LOS F Traffic CountsGreen Valley Rd 200 ft E of Francisco
Traffic Counts:Sum of all ADT counts in El Dorado Hills For all of El Dorado Hills, summing counts from all 50 DOT-sampled locations, projections from long term and short term data differ by no more than 0.75%.
Graphic comparison #1:Road segments in LOS F,years 2011, 2016, and 2021 Highlighting in red indicates LOS F based on ADT: ADT greater than 13,000 for nonrural 2-lane roads, ADT greater than 30,000 for 4-lane roads Counts for 2011 are from County DOT data. Counts for 2016 and 2021 are projected from County DOT data.
2011 LOS F
2016 LOS F
2021 LOS F
Graphic comparison #2:Road segments with at least 80%of traffic levels for LOS F,years 2011, 2016, and 2021 Highlighting in red indicates LOS F based on ADT: ADT greater than 13,000 for nonrural 2-lane roads, ADT greater than 30,000 for 4-lane roads Counts for 2011 are from County DOT data. Counts for 2016 and 2021 are projected from County DOT data.
2011 80% of LOS F
2016 80% of LOS F
2021 80% of LOS F