Download
1 / 16
160 likes | 274 Views
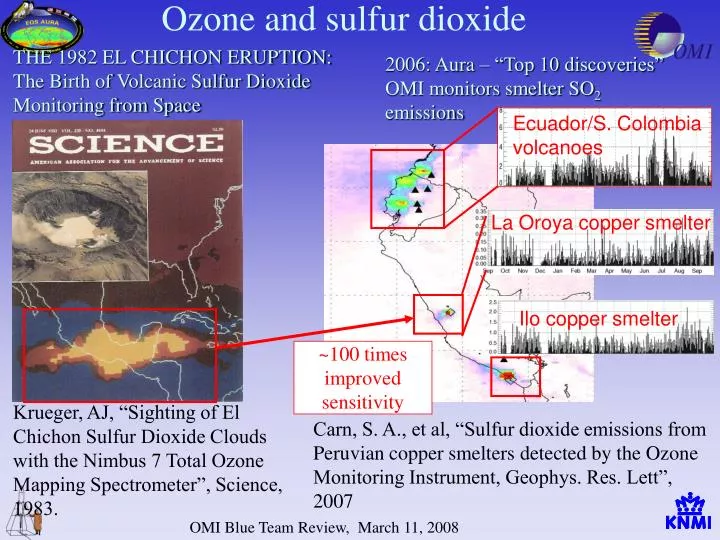
Ozone and sulfur dioxide. THE 1982 EL CHICHON ERUPTION: The Birth of Volcanic Sulfur Dioxide Monitoring from Space. 2006: Aura – “Top 10 discoveries” OMI monitors smelter SO 2 emissions. Ecuador/S. Colombia volcanoes. La Oroya copper smelter. Ilo copper smelter.

E N D
Ozone and sulfur dioxide THE 1982 EL CHICHON ERUPTION:The Birth of Volcanic Sulfur Dioxide Monitoring from Space 2006: Aura – “Top 10 discoveries” OMI monitors smelter SO2 emissions Ecuador/S. Colombia volcanoes La Oroya copper smelter Ilo copper smelter ~100 times improved sensitivity Krueger, AJ, “Sighting of El Chichon Sulfur Dioxide Clouds with the Nimbus 7 Total Ozone Mapping Spectrometer”, Science, 1983. Carn, S. A., et al, “Sulfur dioxide emissions from Peruvian copper smelters detected by the Ozone Monitoring Instrument, Geophys. Res. Lett”, 2007
Public OMSO2 algorithm uses V8.5 TOMS ozone algorithm data Improvements arising from use of RR cloud top heights (OMCLDRR) - previous OMSO2 used TIR-derived cloud height climatology Four SO2 retrievals based on a-priori SO2 vertical profiles or center of mass altitude [CMA]: Planetary Boundary Layer (PBL): CMA = 0.9 km Lower tropospheric column (TRL): CMA = 2.5 km Mid-tropospheric column (TRM): CMA = 7.5 km UTLS column (STL): CMA = 17 km Limited validation of PBL [NE China] and STL [AIRS,TOMS] data to date Volcanic degassing is the principal source of SO2 in TRL-TRM data Current status OMSO2 v1.1.1 N. Krotkov (PI) K. Yang (algorithm development/ implementation) S. Carn (science/validation/applications) A. Krueger (PI, NRT volcanic data for aviation warning)
Improvements arising from use of RR cloud top heights ITCZ clouds over Pacific Ocean Previous TIR cloud top pressure climatology *Positive cloud noise ~1 DU is removed using RR cloud pressure Negative SO2 above bright clouds requires further improvements
AURA’s Ozone monitoring instrument (OMI) can detect smaller amounts of SO2 at higher spatial resolution than any previous satellite instrument OMI allows us to compare man-made SO2 emissions with natural sources (volcanoes) Norilsk Nickel Smelter Anatahan Volcano Soufriere Hills Volcano Oil Refineries Coal Power Plants, China Sierra Negra Volcano Ambrum Volcano Coal Power Plants, South Africa Nyiragongo Volcano, DR Congo Designed by B. Schoeberl
Long-term SO2 burdens over USA, Europe and China East-Aire’05 experiment 25.5 million tons of SO2 was emitted by Chinese factories in 2005 up 27% from 2000
Daily anthropogenic PBL data OMI SO2 burdens need cloud, aerosol and realistic SO2 profile correction !! • Noise ~1.5DU for ideal conditions (near nadir view, no clouds). Only plumes from strong anthropogenic sources of SO2 (such as smelters and coal burning power plants) and from strong regional pollution can be detected in pixel data. • Operational SO2 data need off-line correction for total ozone, SO2 profile, viewing geometry, clouds and aerosol effects.
Future work: Use on-line GOES-5 SO2 profile shape forecasts to account for SO2 lofting during long-range transport above PBL Use A-train cloud and aerosol data to correct AMF PBL product CMA = 0.9 km • Current data: • BRD algorithm [Krotkov et al 2006] • should be used only under optimal viewing conditions • constant AMF for CMA ~0.9 km AMF= 0.3-0.4 SO2 sensitivity AMF= 1 -2
Current data require off-line AMF corrections for geometry, total ozone and aerosols. Future work: Measuring aerosol absorption in the UV wavelengths from ground[ N.Krotkov, J.Herman ] Use A-train cloud and aerosol data to correct AMF for mixed aerosol-cloudy scenes Off-line AMF corrections for ozone, geometry and aerosols
Current data Linear Fit algorithm [Yang et al 2007] The users can use the center of mass altitude (CMA) derived from SO2 vertical distribution to interpolate between the TRL (CMA=2.5km) and TRM (CMA=7.5km) values. Future algorithm Provide AK depending on OMI cloud information Better cloud information will be used from advanced A-train cloud-products Volcanic tropospheric data
Current data: LF algorithm [Yang et al 2007] OMI STL data continue 25+ years of TOMS volcanic data, but improved sensitivity extends the range of detection to smaller eruptions and older clouds LF algorithm underestimates large eruptions > 100DU A-train allows independent retrievals in UV/VIS/IR. Volcanic cloud SO2 burdens (<100DU) agree to within 20% Future work: Non-linear iterative retrieval for largest eruptions (Pinatubo) Volcanic Stratospheric (STL) data Earth Probe TOMS (11:00 am) Aqua AIRS (1:30 pm) Aura OMI (1:45 pm)
Anthropogenic SO2 GSFC: Mian Chin - GOCART modeling of the global sulfate cycle, aerosol pollution , effects on surface radiation (global dimming); UMCP: R. Dickerson, Can Li, Z. Li: Air quality and tropospheric chemistry studies; understanding long-range pollution transport. Dalhousie University : Aaron van Donkelaar, Randall Martin: Long-range Transport of Asian Sulfur Emissions NSF-VOCALS team: Effects of sulfur emissions in South America on the Southeast Pacific climate system U-Thessaloniki, Greece (Sulfur emissions in Eastern Europe) Data users: close collaboration Volcanic SO2 NRT Volcanic Applications: • NASA CAN for NRT volcanic cloud data for aviation hazards – A. Krueger • NOAA/NESDIS - G. Serafino, G. Vicente • Volcanic Ash Advisory Centers (VAACs) • European SACS BIRA/IASB NRT SO2 web site • USGS Volcano observatories: Alaska (AVO), Cascades (CVO), Hawaii (HVO) • Kamchatka Volcanic Eruption Response Team (KVERT), Petropavlovsk-Kamchatsky, Russia • Instituto Geofisico, Quito, Ecuador • INGEOMINAS, Colombia • Goma Volcano Observatory, DR Congo • IRD, Noumea, New Caledonia (monitoring volcanoes in Vanuatu) • GNS Science, New Zealand AQ Applications: • U-Iowa and ANL: Air Quality Emission inventory and Air quality forecast DSS (PI: Carmichael and Styreets ; Ken Pickering, GSFC): comparing USA and Chinese emissions using regional models and OMI data;
GES DISC Data Distribution Statistics (based on Total Number of Users in Year 2007) 1. Unresolved 2. USE educational 3. Russian Federation 4. US Government 5. Network (.net) 6. India 7. Germany 8. France 9. United Kingdom 10. Indonesia All others All Others (in order of number of Users): Canada, International treaty Organizations, Commercial (.com), Netherlands, Greece, New Zealand, Chile, Belgium, Israel, Colombia, Spain, Italy, Estonia, China, Switzerland, Ecuador, Norway, Japan, Total SO2 Users in Year 2007: 900 (based on visitors who showed activity of more than 1 minute at the SO2 FTP Data Directory site) Total Number of Page Hits at SO2 FTP Directory(excluding Search & Robot Engines) = 2.1 millions in 2007
Carn, S. A., et al (2007a), Sulfur dioxide emissions from Peruvian copper smelters detected by the Ozone Monitoring Instrument, Geophys. Res. Lett., Carn, S.A., et al (2007b), Extended observations of volcanic SO2 and sulfate aerosol in the stratosphere, Atmos. Chem. Phys.Discuss., 7, 2857-2871. Dickerson, R. et al (2007), Aircraft observations of dust and pollutants over NE China: Insight into the meteorological mechanisms of long-range transport, J. Geophys. Res.- EAST-AIRE special session, December 2007 Krotkov, N.A., et al (2008), Ozone Monitoring Instrument (OMI) SO2 validation over NE China, J. Geophys. Res., (in press) Carn, S.A., et al (2008a, Daily monitoring of Ecuadorian volcanic degassing from space, J. Volcanol. Geotherm. Res., (in press). Carn, S.A., et al (2008b), Tracking volcanic sulfur dioxide clouds for aviation hazard mitigation. Natural Hazards, Special Issue on Aviation Hazards from Volcanoes ~18 presentations at AGU, EGU, ENVISAT, OMI ST, Aura ST, Cities on Volcanoes 4,5, >10 stories on Earth Observatory web site (Simon Carn), NASA OMI SO2 poster very popular (courtesy to Mark and Barbara Schoeberl ), PBS TV program Summary of research with released data:
Validation OMI SO2 Aerosol • AVDC - overpass data sets for ~50 power plants and Brewer locations – Bojan Bojkov • New DOAS mini-spectrometers (PANDORA near pollution sources – Jay Herman & A. Cede, NOVAC near volcanoes– Bo Galle & S. Carn) • SO2 balloon (UMCP- R. Dickerson and UMCP student project ) • In-situ aircraft (EAST-AIRE- China2005; TC4 South America 2007; …) SO2
SO2 (DU) from OMI on 04/07/2005 SO2 (DU) from GOCART on 04/07/2005 DU 4.00 Pollution Pollution 3.64 3.28 50N 2.92 40N 2.56 2.20 30N 1.84 Volcano Volcano 1.48 20N 1.12 10N 0.78 0.40 100E 110E 120E 130E 140E 150E Sulfate (DU) from GOCART on 04/07/2005 GOCART model comparisons • On April 7, 2005, OMI detected SO2 pollution plume inland and off-shore of China, as well as volcanic plume from Anatahan Volcano (top left panel). • The GOCART model reproduces similar SO2 distributions (top right), as well as predicts the amount of sulfate that is produced from SO2 oxidation (bottom right). • Future work: • Use on-line GOCART (GEOS-5) forecasts of SO2 and aerosol profile shapes • Use GOCART aerosol composition data for AMF corrections
New Spectral Fit algorithm Better stray light and Ring corrections Using SO2 profiles from GEOS-5 model Activities: 2008-2009 Activities: 2010-2011 • Better aerosol and cloud correction using A-train data and improvements based on comparison with models and measurements. Activities: 2012- • algorithm improvements to account for changes in instrument performance • Transition to future instruments