Download
1 / 23
230 likes | 327 Views
Introductions. John White, Director of Product Management Joined iModules January, 2014 Background in product management and data products Kansas State Alumni Association 1995-2000 Jason Roberts, SVP Customer Success Joined iModules in 2012 Leads the Client Services organization

E N D
Introductions John White, Director of Product Management • Joined iModules January, 2014 • Background in product management and data products • Kansas State Alumni Association 1995-2000 Jason Roberts, SVP Customer Success • Joined iModules in 2012 • Leads the Client Services organization • Background in applying Advanced Analytics
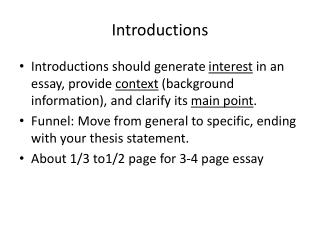
Actionable Insights • What is it? • Why are we doing this? • Why is this important to each of you?
Online Engagement Challenges • Identify who is engaged online and who is not, and who is likely to become engaged in the future • Strategies to increase online engagement • Segment and target communications • Measure results • Track engagement over time • Control, reduce or reallocate expenses
Focus • Use Encompass datato help clients target constituents more effectively – thereby increasing online engagement in a more cost effective manner.
Data: email activity, event activity, online giving, membership Data Analysis Process • Hygiene/Append • Data Mining & Modeling Process • Proprietary, Custom Scoring Models (CEI, PEI)
Engagement Scores • Constituent Engagement Index (CEI) • Custom model that uses three years of engagement data from Encompass: • Email activity, event activity, online giving, membership (if applicable) • Measures a constituent’s level of online engagement via Encompass • Potential Engagement Index (PEI) • Custom model uses data from Encompass and external (appended) data: • The model identifies up to 13 predictive values - combination of predictive values is unique to each institution • Measures a constituent’s propensity to engage online • Engagement Quadrant (EQ) • Using CEI and PEI scores, each constituent plotted to a quadrant • Key Target, Keeper, Committed, Unlikely Target
Engagement Quadrants (N=96,493 41.8%) (N=23,145 10.0%) Total N=230,805 PEI Mean 5.5 (N=13,172 5.7%) (N=97,995 42.5%) CEI Mean 122.3 0
Engagement Quadrants – by location Within 150 miles: 50,167 (36%) Outside 150 miles: 46,057 (51%) Within 150 miles: 12,855 (9%) Outside 150 miles: 10,227 (11%) Within 150 miles: 138,850 Outside 150 miles: 91,197 Within 150 miles: 66,520 (48%) Outside 150 miles: 31,097 (34%) Within 150 miles: 9,308 (7%) Outside 150 miles: 3,816 (4%) 0
Engagement Quadrants – by grad year 1980’s: 16,990 (52%) 2000’s: 19,068 (43%) 1980’s: 4,756 (14%) 2000’s: 4,045 (9%) 1980’s: 32,927 2000’s: 44,133 1980’s: 9,686 (29%) 2000’s: 18,572 (42%) 1980’s: 1,495 (5%) 2000’s: 2,448 (6%) 0
Applying Actionable Insights: Alumni Relations and Communications • Impact offline activity • Adjust communication strategy based on propensity to engage online • Potential for budget reallocation (print/postage dollars) • Additional data point to identify prospective volunteers, mentors, Board members… • Increase online engagement • Enhance your current segmentation • Modify communication strategy • Message • Frequency • Longitudinal view of constituent engagement • Identify online ambassadors
Applying Actionable Insights:Development Impact offline activity • Combined with other metrics a more complete constituent perspective is achieved • Focus time and budget offline on those that are not likely to engage online • Increasing alumni participation and support • Enhance your current segmentation • Stewardship opportunity for donors who engage online • Better insight into the Constituent’s preference • Identify highly engaged non-donors – and engage them
Making the Insights Actionable • With Actionable Insights you will be able to: • Target the populations to drive overall engagement • Make conscious decisions around higher investments to drive engagement • Set clear objectives, with specific actions and responses that are measureable Strategies and goals Measure and evaluate Actionable Insights Target and message Execute Determine measurements
Actionable Insights Example Objective: Drive increased engagement among Alumni living more than 150 miles from campus, with a focus on event participation Within 150 miles: 50,167 (36%) Outside 150 miles: 46,057 (51%) Within 150 miles: 12,855 (9%) Outside 150 miles: 10,227 (11%) Within 150 miles: 66,520 (48%) Outside 150 miles: 31,097 (34%) Within 150 miles: 9,308 (7%) Outside 150 miles: 3,816 (4%) Measurement: Near term: Increased open rates, click through, and registrations for the events. Long term: Increased engagement (shift in engagement distribution) 0
Actionable Insights - Example • Identify the Populations • Use the Engagement Quadrants for those that are > 150 miles from campus, but have not attended an event in the last year • Execute Strategy against each Quadrant • ‘Key Targets’ – have different communication cadence and content • ‘Keeper’ and ‘Committed’ – care and feeding Top 10k Alumni Outside 150 miles: 46,057 (51%) 0
Actionable Insights - Example • Measuring Results • Changes in Engagement are not a short term measure • Strategies focus on changing behavior, not just a ‘click’ • Targeted segments of the population are compared to their baseline for changes Selected Population 0
Actionable Insights Features • Actionable data • Minimal workload • Aligns with current business processes • Statistically based, custom models • Models are not static • Services included to support success • Optimize use of Encompass
Future Development • Model inputs • Reporting and analytic capabilities • Trend analysis
iModules Actionable Insights Available Now
Who to Contact • Moving Forward • Your account manager • Sizzler • Your account manager • John White • Jason Roberts • Mirko Widenhorn
Contact Information • John White • Director of Product Management • jwhite@imodules.com • Jason Roberts • Senior Vice President, Customer Success • jroberts@imodules.com