Download
1 / 32
320 likes | 495 Views
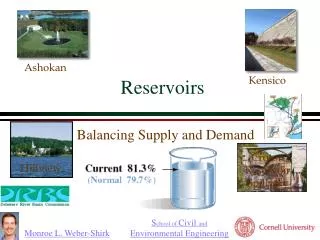
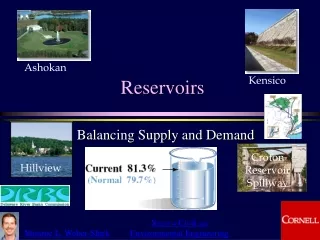
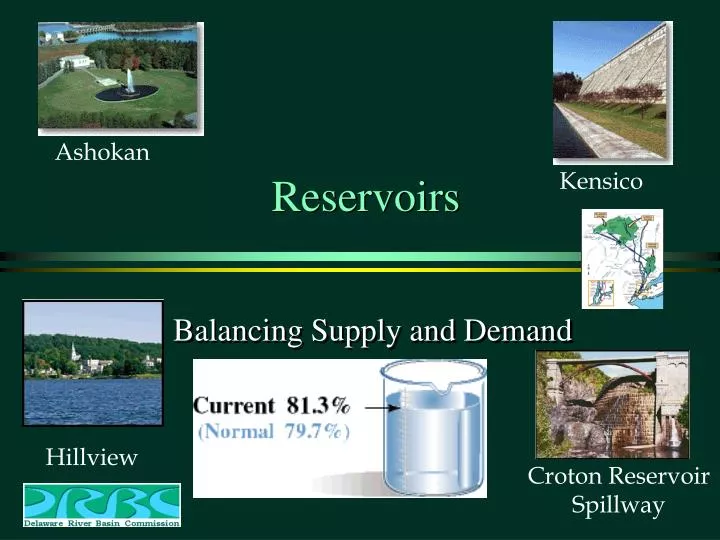
Ashokan. Reservoirs. Kensico. Balancing Supply and Demand. Hillview. Croton Reservoir Spillway. Water Supply and Demand Fluctuations. Supply Seasonal supply fluctuations Buffered using _________ reservoirs Demand Seasonal demand fluctuations Daily demand fluctuations

E N D
Ashokan Reservoirs Kensico Balancing Supply and Demand Hillview Croton Reservoir Spillway
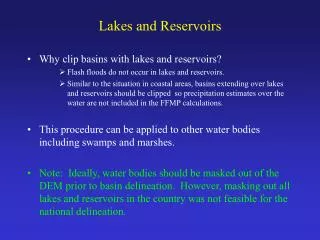
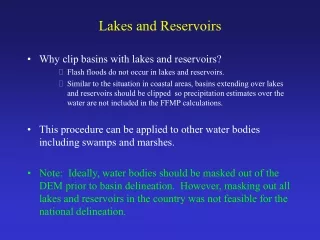
Water Supply and Demand Fluctuations • Supply • Seasonal supply fluctuations • Buffered using _________ reservoirs • Demand • Seasonal demand fluctuations • Daily demand fluctuations • Buffered using _________ reservoirs • Effect of flow fluctuations on system design • Size of balancing reservoirs • pipe sizes watershed distribution
Average Total Monthly Flow into Pepacton Reservoir (0.540 km3 storage) Reservoir full (hopefully) 140 120 100 80 Million m3/month average 60 40 20 0 Deficit provided by storage July May March January November September 38 190 ____ million m3/month * __ month = ___ million m3 5 Better design is based on drought conditions!
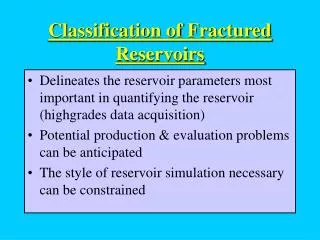
What is the safe yield from the Cannonsville Reservoir? • What is the maximum rate that we can withdraw water from the Cannonsville Reservoir without emptying the reservoir?_________________________________ • What are the critical events in history that determine how big the reservoir has to be?__________ The average stream flow into the reservoir. Droughts
Reservoir Mass Balance Equations + = + Storage Cumulative Inflow Initial storage Cumulative Outflow O = Cumulative (________ + _________ + ___________ ) Demand River flow Evaporation True at any time! or Ii= Di=
1000 990 980 Density (kg/m3) 970 960 950 0 50 100 Temperature (C) 1000 999 Density (kg/m3) 998 997 0 10 20 Temperature (C) Density of Water • Density (mass/unit volume) r • density of water: 1000 kg/m3
Downstream River Flow? • Simplest operating rule • Waste from reservoir when reservoir is full • Don’t waste from reservoir if reservoir isn’t full • More complex rules could easily be incorporated into a spreadsheet model • Minimum discharge into stream as a function of reservoir storage volume or ______________ • Based on regulations drought status
Reservoir Rules in Equation Form When Si = Smax When is reservoir full? ___________________ Reservoir is overflowing Overflow goes into river No additional river flow Reservoir Capacity Smax=
Cannonsville Reservoir Storage (Demand of 1.04 x 10⁶ m3/day) How could we increase safe yield? Increase reservoir volume
1.5 1 0.5 0 0 250 500 750 1000 Storage vs. Safe Yield for Cannonsville Reservoir What is the asymptote? Average stream flow safe yield (million m3/day) 367 storage volume (million m3)
NYC Reservoirs • NYC supply reservoirs have a storage capacity of 550 billion gallons (2 km3) • How long could NYC go without any inflow into the reservoirs? • Current Reservoir levels (http://www.ci.nyc.ny.us/nyclink/html/dep/html/current.html) solution Reservoir Levels
Empty NYC Reservoirs? • What happens as Reservoir Levels drop? • __________________________________ • __________________________________ • __________________________________ • __________________________________ • __________________________________ Nutrient levels increase (less dilution) Algae grows (taste and odors) Water quality deteriorates Shorter residence time (less time for pathogens to die) Drought watch
Seasonal, Daily, and Hourly Fluctuations • Substantial increase in water demand during summer due to_______________________ • Peak flows___________________________________________________________ • Low flows______________________ watering lawns, swimming pools Early morning as people get ready to go to work/school Commercial Breaks (not any more) Between midnight and 5 am
Estimates of Daily and Hourly Fluctuations* • As the time period of analysis decreases in length the maximum rate of water demand during that time period __________ • If the average annual flow rate is 1.0 then • the maximum season rate is 1.25 (summer) • the maximum daily rate is 1.5 (range of 1.2-2.0) • the maximum hourly rate is 2.5 (range of 1.5-3.5) • for NYC the maximum instantaneous rate was _____ increases 1.75 *Henry and Heinke p 386
Methods to Even Out Fluctuations • Seasonal fluctuations • Source (watershed) reservoirs • Kensico and West Branch Reservoirs • Daily fluctuations • Hillview and Jerome Park Reservoirs (directly connected to distribution tunnels) • Hillview has 3.4 million m3 useable storage • Flows from Kensico to Hillview are adjusted every ________ two hours
Balancing Reservoirs OK Fred, I’ll go give it another turn. Did you say you have more water than you need? Hey Bob, I need some more water. Could you open the valve another turn? Where are the largest tunnels in the NYC water supply and distribution system?
How Can You Estimate Required Balancing-Reservoir Capacity? • Variable supply • Variable demand • Analyze historic record to search for worst case conditions • Use same Mass Balance analysis • Include variable ________ in analysis • Other unusual demands… demand Fire fighting needs Maintenance of supply tunnels Main breaks
Summary • An understanding of the variability in supply and demand are essential for the sizing of reservoirs and pipes in a water supply system • Supply Reservoirs must be sized to store water during drought periods • Balancing Reservoirs must be sized for daily or hourly fluctuations • Distribution pipes must be sized to handle peak flows
Catskill/Delaware Watersheds Schoharie Cannonsville Pepacton Ashokan Roundout Neversink
Empty NYC Reservoirs • NYC supply reservoirs have a storage capacity of 550 billion gallons (2 km3) • Average demand is 61 m3/s • How long could NYC go without any inflow into the reservoirs?
Cannonsville Reservoir Storage (Demand of 0.5 x 10⁶ m3/day) Stream flow gage station map
Cannonsville Reservoir Storage (Demand of 0.75 x 10⁶ m3/day)