Download
1 / 13
260 likes | 588 Views
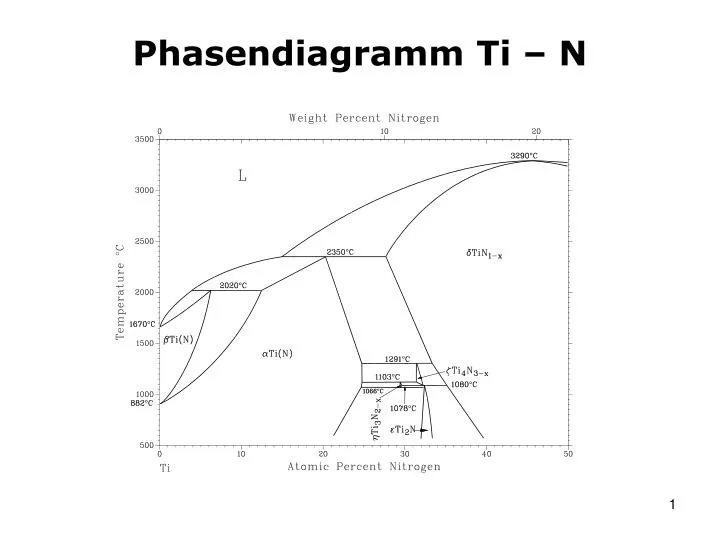
Phasendiagramm Ti – N. Phasenumwandlung im Ti. 882°C. -Ti, P6 3 /mmc (hexagonal) a = 2,95 Å, c = 4.69 Å Abstände zwischen den Schichten: c/2 = 2,345 Å Atomare Abstände In-plane: a = 2,95 Å Out-of-plane (z-Richtung): 2,898 Å. -Ti, Im3m (kubisch) a = 3,311 Å

E N D
Phasenumwandlung im Ti 882°C -Ti, P63/mmc (hexagonal) a = 2,95 Å, c = 4.69 Å Abstände zwischen den Schichten: c/2 = 2,345 Å Atomare Abstände In-plane: a = 2,95 Å Out-of-plane (z-Richtung): 2,898 Å -Ti, Im3m (kubisch) a = 3,311 Å Abstände zwischen den Schichten: a(2)/2 = 2,341 Å Atomare Abstände In-plane: a (3)/2 = 2,867 Å Out-of-plane: a = 3,311 Å
Stickstoffdiffusion in Titan -Ti3N2-x -Ti4N3-x -Ti -TiN -Ti2N
Stickstoffdiffusion in Titan Ti N -Ti2N, P42/mnm a = 4,945 Å; c = 3,034 Å Ti: 4f (0.296, 0.296, 0) N: 2a (0, 0, 0) -Ti(N), P63/mmc a = 2,95 Å; c = 4,69 Å Ti: 2c (⅓, ⅔, ¼)
Stickstoffdiffusion in Titan -Ti3N2-x, R-3m a = 2,981 Å; c = 21,664 Å Ti: 6c (0, 0, 0.2222) Ti: 3a (0, 0, 0) N: 6c (0, 0, 0.3889); 43% N: 3b (0, 0, ½); 43 % besetzt -Ti4N3-x, R-3m a = 2,980 Å; c = 28,965 Å Ti: 6c (0, 0, ⅛) Ti: 6c (0, 0, 0.291) N: 6c (0, 0, 0.415); 58% N: 3a (0, 0, 0); 58% besetzt N: 3b (0, 0, ½); 58 % besetzt … N Ti N Ti N Ti
Stickstoffdiffusion in Titan -TiN, Fm3m (kubisch) NaCl – Struktur a = 4,2418 Å Abstände zwischen den Ti oder N-Schichten: a(3)/3 = 2,449 Å Atomare Abstände In-plane: a(2)/2 = 2,999 Å Out-of-plane: a(2)/2 = 2,999 Å
Phasenübergänge in Fe3Al Geordnete Struktur, Phase D03 (Fm3m) T < 550°C Fe: 8c (¼, ¼, ¼) Fe: 4b (½, ½, ½) Al: 4a (0, 0, 0) Ungeordnete Struktur, Phase A2 (Im3m) 800°C < T Fe + Al: 2a (0, 0, 0) Teilweise geordnete Struktur, Phase B2 (Pm3m) 550°C < T < 800°C Fe: 1b (½, ½, ½) Fe + Al: 1a (0, 0, 0)
-Messing: Cu5Zn8 Geordnete kubische Struktur I-43m a = 8.878 Å Sehr spröd fcc - Cu hcp - Zn
-Messing: Cu5Zn8 [111] 3 [001] -4 [110] m Raumzentriert
Atomare Anordnung in Cu – Au Au Cu Fm3m Au-Cu Au3Cu, Pm3m AuCu, P4/mmm AuCu3, Pm3m