Download
1 / 15
150 likes | 269 Views
Projecting Plattsburgh population. Cornell projection model. Cohort Component Method By sex and 5-yr age categories 0-4, …, 85+ Build for county level projections Base 2005, projected 2010, 2015, …, 2035. Cohort Component Method. Model input. Population at beginning. Death rates.

E N D
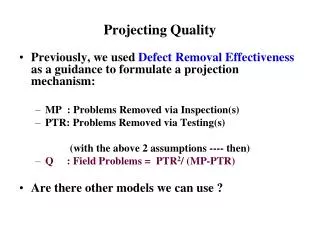
Cornell projection model • Cohort Component Method • By sex and 5-yr age categories • 0-4, …, 85+ • Build for county level projections • Base 2005, projected 2010, 2015, …, 2035
Cohort Component Method Model input Population at beginning Death rates Migration rates, etc. Birth rates
Death rates (county level) • Based on calculated lifetable • Death rates calculated as:Rateagegroup = (Deathsagegroup from Oct 1998 – Oct 2001) / 3 divided by #populationagegroup • Death data from NY Department of Health • Age group size from Census 2000
Death rates (Plattsburgh) • Same as Clinton County
Migration rates, etc. (county) • Calculate age/sex distribution of in- and out-migration • Rates based on ‘Where did you live 5 years ago’ • Population ‘at risk’ of in-migration from Census Bureau projections • Calculated total Net-migration indepentely • Rates based on residual method (average over 1990-1995, 1995-2000, 2000-2005) • Calculate in-migration and out-migration counts by sex and cohort
Migration rates, etc. (Plattsburgh) • In-migration rates adjusted to reflect different age pattern of in-migrants • Out-migration rates: same as Clinton County • Checked for relation between rates and college enrollment • Relative more immigration • Crude migration: same as Clinton County
Birth rates (county) • Based on Age Specific Fertility Rates • Assumptions calculated as:Rateagegroup = (Birthsagegroup from Oct 1998 – Oct 2001) / 3 divided by #femaleagegroup • Birth data from NY Department of Health • Age group size from Census 2000
Birth rates (Plattsburgh) • Birth rates for 15-19 and 20-24 adjusted • Looked at county level relation between ‘enrolled in school’ and ‘birth rates’ • Birth rates for 25 and older: same as Clinton County
Clinton County Plattsburgh
Clinton County Plattsburgh
Base population • Project Census 2000 population to 2005 and rake to 2005 total population estimates
What-if: • Age specific fertility rate 20-24 assumption too low • A new industry comes to town
New industry assumptions • One time inflow of skilled workers with their families • Assumption steps: • sex/age needed employees (1600 total) • How many from within county (less skilled) • Add partners from new arrivals • Add children from new arrivals • Divide between Plattsburgh and remainder • Total inflow: ca. 3600