Download
1 / 92
930 likes | 1.08k Views
Chapter 3 Averages and Variation. Quick Talk:. Think back to middle school and high school (before taking Mr. Liu’s awesome statistics class). What do you think of when you heard of statistics?. Answer. The 3 M’s. Mean, median and mode. What is mode?.

E N D
Quick Talk: • Think back to middle school and high school (before taking Mr. Liu’s awesome statistics class). What do you think of when you heard of statistics?
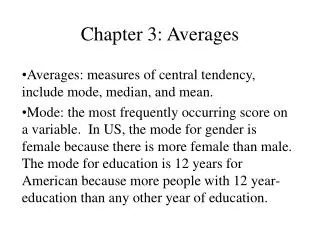
Answer • The 3 M’s. Mean, median and mode
What is mode? • Mode is the value that occurs most frequently
Group Work: What is the mode out of this data set? • 25, 37, 12, 27, 69, 64, 44, 30, 50, 52, 65, 25, 10, 12, 60, 27, 12, 65, 25
Answer • 12 and 25
Group work • What is the mode out of this data set? • 5 3 7 2 4 4 2 4 8 3 4 3 4 8 6 2 4 5 3 4 5 9 8 7 1
Answer • 7
What is a median? • Median can be represented as “x tilde”. Median is the central value of an ordered distribution (the exact middle)
How to find median? • 1) Order the data from smallest to largest • 2) For an odd number of values in the distribution, Median= Middle data value • 3) For an even number of data values in the distribution,
Group Work • Find the Median • 19 20 25 36 48 35 21 18
Answer • 18 19 20 21 25 35 36 48 • Because it is even, I add (21+25)/2 = 23 • So median = 23
Group Work • Find the median • 36, 4, 69, 47, 81, 84, 6, 38, 17, 93, 46
Note: • Median uses the position rather than the specific value of each data entry. If the extreme values of a data set change, the median usually does not change. • It is often used as the average for house prices.
Median Rule • For an ordered data set of size n,
Example: • If n = 77, then the middle value is (77+1)/2= 39th number. • If n=90, then the middle value is (90+1)/2=45.5th value. Which is in between 45th and 46th number.
What do you mean Mean? • Mean means average. • It is aka arithmetic mean
Group Work • Find the mean: 58, 92, 50, 68, 80, 64
Group Work: Word problem • Mr. Liu is a Paladin Tank that’s low in HP. He only has 2 hits left before the boss unleash his ultra super attack and pwns Mr. Liu. The boss has a total of 750 HP and Mr. Liu has damaged the boss with the following damage points: 98, 50, 65, 71, 120, 84, 93, 27. What is the mean damage of the next 2 hits so that Mr. Liu survives?
Answer • Many ways to solve this… depend on how you think about it. • The mean is 71 damage points for the next 2 hits.
Resistant measure • Resistant measure is one that is not influenced by extremely high or low data values.
Quick Talk: • Which of the following data has more of a resistant measure, mean or median?
Answer • Median, although the disadvantage of the median is that it is not sensitive to the specific size of a data value. • Mean is too sensitive to the data value.
How do we make mean more resistant yet sensitive? • It is called 10% trimmed mean • Procedures: • 1) Order the data from smallest to largest • 2) Delete the bottom 5% or the data and the top 5% of the data. Note: If the calculation of 5% of the number of data values does not produce a whole number, round down to the nearest integer • Ex: if you get .75, you round to 0 • Ex: if you get 1.95, you round to 1 • 3) Compute the mean of the remaining 90% of the data
Example situation • Here are some sample class sizes for introductory lecture courses • 14, 30, 45, 11, 20, 80, 65, 34, 18, 60, 100, 42, 40, 40, 78, 31, 52, 35, 120, 19 • A) compute the mean • B) compute the 10% trimmed mean • C) Find the median • D) Find the median of the 10% trimmed data set. Does the median change when you trim the data? • E) Is the trimmed mean or the original mean closer to the median?
Answer • A) 46.7 • B) 44.61 • C) 40 • D)40 • E) Trimmed mean is closer to the median
Group Work • How old are basketball players? Here are some of the ages: 40, 38, 21, 18, 24, 23, 28, 25, 21, 27, 26, 25, 31, 32, 19, 29, 33, 24, 23, 35, 24, 23, 25, 32, 39, 26, 31, 28, 30, 31, 22, 23, 24, 25, 26, 27, 38, 27, 26, 22 • A) compute the mean • B) compute the 10% trimmed mean • C) Find the median • D) Find the median of the 10% trimmed data set. Does the median change when you trim the data? • E) Is the trimmed mean or the original mean closer to the median?
Answer • A) 27.275 • B) 27.083 • C) 26 • D) 26 • E) Closer
Weighted Average • This deal with my class especially!!! • w= weight
Example • If your midterm is worth 40% of your total grade and your final is worth 60% of your total grade, you got 70 on your midterm and 90 on your final. What is your final grade? • you would have a B
Group Work: Mr. Liu’s grading weights • Test/Quizzes 30 % • Participation/bell work 10 % • Notebook 15 % • Projects 20 % • Homework 15 % • Finals 10 % • You scored 85% on test/quizzes • You scored 60% on Homeworks • You scored 100% on participation/bell work • You scored 80% on projects • You scored 98% on notebook • You scored 50% on finals • What is your grade for the class?
Answer • .85(.30)+.60(.15)+1(.10)+.80(.20)+.98(.15)+.50(.10)=.255+.09+.10+.16+.147+.05=.802 or 80.2% which is a B-
Homework Practice • P83 #1-5, 8, 12, 14, 17
Note: • An average is an attempt to summarize a set of data using just one number. But it itself may not always be very meaningful. • We need a statistical cross-reference that measures the spread of the data.
The first Variation • Range: is the difference between the largest and smallest values of a data distribution
Remember how to find range? • Tell me
Group Work • Average tennis balls suppose to weigh around 56g. Random balls are selected from two suppliers to see which of them are more accurate. • Supplier 1: 46 56 56 60 62 • Supplier 2: 46 54 58 60 62 • A) Compute the range of each supplier • B) Compute of mean weight from both supplier • C) If you are competing in a competition, which supplier would you choose from?
Answer • A) Supplier 1= 16 • Supplier 2= 16 • B) Supplier 1 mean=56 • Supplier 2 mean= 56 • C) You would choose supplier 1 because more balls are around the mean. “More clustered at the mean”
Variance and Standard Deviation These are a measure of the distribution or spread of data around an expected mean ( Variance is a measure of how far a set of numbers is spread out. • A variance of zero indicates that all the values are identical. • A non-zero variance is always positive: • a small variance indicates that the data points tend to be very close to the mean (expected value) and hence to each other. • a high variance indicates that the data points are very spread out from the mean and from each other. Standard Deviation shows how much variation or dispersion from the average (mean, also called expected value) exists • A low standard deviation indicates that the data points tend to be very close to the mean • a high standard deviation indicates that the data points are spread out over a large range of values.
Now the fun begins….formulas!! • Are you prepared? • Note: I will be covering both sample statistics and population parameters
Defining Formulas (Sample Statistic) • Sample mean= • Sample variance= • Sample standard deviation= • Where x is a member of the data set, is the mean, and n is the number of data values. The sum is taken over all data values.
Practice • Random Sample • 5 7 8 12 15 15 • Find the variance and standard deviation
Group Work • Random Sample • 5 5 5 6 7 8 • Find the variance and standard deviation
Population Parameters • Population mean= • Population Variance= • Population standard deviation= • Where N is the number of data values in the population and x represents the individual data values of the population
Note: • Samples are usually in “english alphabets” • Populations are usually in “greek alphabets” • Samples are in lower case • Population are in upper case
Conversion from • You can find out the population standard deviation very easily if you have sample standard deviation.
Group Work • s=1.79 • You have 60 samples • Find