Download
1 / 57
570 likes | 587 Views
Explore the history and significance of DIFAX weather maps, essential for meteorologists and forecasting students. Learn how to interpret surface charts, plotted data, and radar composite analyses.

E N D
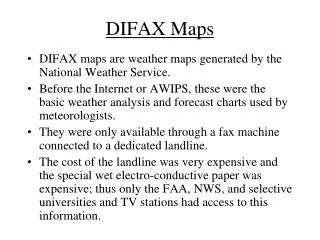
DIFAX Maps • DIFAX maps are weather maps generated by the National Weather Service. • Before the Internet or AWIPS, these were the basic weather analysis and forecast charts used by meteorologists. • They were only available through a fax machine connected to a dedicated landline. • The cost of the landline was very expensive and the special wet electro-conductive paper was expensive; thus only the FAA, NWS, and selective universities and TV stations had access to this information.
The images were actually burned onto the special FAX paper by electrical currents in the FAX machine. • The rotating helical blade in the fax machine which conducted the electricity to the paper was a deadly weapon: • It was as sharp as a razor and many a person was sliced open by this blade while changing paper rolls or changing the blade itself.
DIFAX maps, although gradually being phased out, are still available on the internet. • These maps are still unique and contain information which is priceless for operational meteorologists. • All students of meteorology & forecasting will benefit from knowledge of these maps and their interpretation. • Essentially, if you understand how to interpret a black&white DIFAX chart, you should have no problem interpreting pretty colored charts from other sources.
DIFAX Map Descriptions DIFAX maps fall under 2 general categories • Basic data and analysis products • Plotted data • Analyses of basic variables • Forecast products • (generally produced at NCEP) We will concentrate on the first category.
Surface Charts • Analyzed charts issued every 3 hours (0000Z - 2100Z) (http://www.hpc.ncep.noaa.gov/html/about_sfc.shtml) • Data includes • hourly synoptic stations • ship reports • buoy reports • (Maps may be found at the Hydrological Prediction Center) • http://www.hpc.ncep.noaa.gov/html/sfc2.shtml • Plotted data example • http://www.hpc.ncep.noaa.gov/html/stationplot.shtml
Surface Charts (continued) • Isobar analysis: • 4 mb increments labeled with tens and units digit (96, 00, 04, etc...) • Lows and Highs labeled with L and H with the pressure value labeled nearby (in whole mb) • Frontal Analysis • http://www.hpc.ncep.noaa.gov/html/fntcodes2.shtml • Use: • Current depiction of surface weather features (most valuable weather chart)
Plotted Data Only • Plotted data is available hourly from the HPC • http://www.hpc.ncep.noaa.gov/sfc/sfcobs/sfcobs.shtml
Aviation Surface Analyses • Contains analyzed surface charts and plots. • http://www.hpc.ncep.noaa.gov/html/avnsfc.shtml • Plots show only the temperature, wind, cloud cover, current weather, and cloud ceiling. • http://www.hpc.ncep.noaa.gov/html/stationplot_awc.shtml
DIFAX Map Access: • Many DIFAX maps are no longer available, however some of the more important maps are still being produced. • They can be found at: • South Alabama Synoptic Page • www.southalabama.edu/meteorologyclub/synoptic/ National Weather Service: • http://weather.noaa.gov/fax/nwsfax.html SUNY Albany • http://www.atmos.albany.edu/weather/difax.html
DIFAX Radar Composite Analysis • Gridded from individual radars on a grid (grid spacing roughly 48 km at 60N) (see overhead) • Entire grid box is assigned the largest value observed anywhere within the grid box (see overhead) • Shading represents echo areas • Contours are incremented Level 1-3-5 on a scale of 0-6. (VIP Levels)
Echo Tops (tens & hundreds digit 540 truncated: 540=54,000 ft top) • Echo bases (tens & hundreds digit 040 truncated: 040=4,000 ft base) • NE = No Echos • NA = Not Available • Movement of Areas and Lines: • Pennants From W at 45 kts • Movement of Cells: • Arrows and speed 45 From the WSW at 45 kts
Precipitation Type and Change of Intensity R Rain RW Rainshower TRW Thunderstorm S Snow SW Snowshower TSW Thunder-snowshower ZR Freezing rain + New area/cell or increasing intensity - Decreasing intensity
Special Severe Weather Designations (Note: These are less common with Doppler radar network) HOOK Hook echo (tornadic mesocyclone) HAIL Radar-detected hail LEWP Line Echo Wave Pattern (bow echoes) WER Weak Echo Region BWER Bounded Weak Echo Region (supercell mesocyclone) • Watch Boxes WS: Severe Thunderstorm Watch WT: Tornado Watch
Radar charts are issued nearly hourly • Distributed approximately 1 h after valid time • Data captured at 35 minutes after the hour • Use • Indicates areal coverage, type, intensity and movement of precipitation
Real-Time Radar and Satellite Links • National Weather Service Doppler Radar • http://www.srh.noaa.gov/radar/national.html • Geostationary Satellite Imagery: • http://www.ghcc.msfc.nasa.gov/GOES/
Weather Depiction Chart • Primarily for Aviation-sensitive weather conditions • Issued every 3 hours at 01, 04, 07, 10, 13, 16, 19, & 21Z) >>> i.e. 1-hour after synoptic times • Comprised of METAR, cloud, visibility, and current weather information. • Fronts are from the previous hour. • Plotting guide (see handout).
IFR: Instrument Flight Rules Ceiling < 1000 ft and or Visibility < 3 SM • MVFR: Marginal Visible Flight Rules 1000 ft < ceiling < 3000 ft 3 SM < visibility < 5 SM • VFR: Visual Flight Rules ceiling > 3000 ft visibility > 5 SM
Maximum Temperature Chart • Displays the highest temperatures recorded for the 12 hours prior to 00Z each day. Time period: (d-1/12Z - d/00Z) • Sometimes, the highest temperatures occur at times other than within this 12-hour window; these occurrences will not be reflected on this chart. • The most common “outside” occurrence of a maximum temperature is heavily influenced by frontal passages.
Minimum Temperature Chart • Displays the lowest temperatures recorded for the 12 hours prior to 12Z each day. Time period: (d/00Z - d/12Z) • Sometimes, the lowest daily temperatures occur at times other than within this 12-hour window; these occurrences will not be reflected on this chart. • The most common “outside” occurrence of a minimum temperature is during the winter shortly after 12Z. • Frontal influence is also a big factor
Record High and Low Temperatures • Record high and low temperatures are noted on the chart by the l being replaced by a Y. • The type of record is given in the box (situated in the Gulf of Mexico): HI vs LO E: Equalled EX: Exceeded FM: Record for entire month DA: Record for the day
AT: All-time record SE: Record for so early in the year (summer/fall freeze, etc...) SL: Record for so late in the year (spring/summer freeze, etc...) Examples: HIEXDA LOEAT LOEXSE
24 Hour Precipitation Chart • Shows liquid-equivalent precipitation totals over a 24 hour period: (d-1/12Z - d/12Z) • Precipitation is to the nearest hundredth of an inch. • Inch digit is larger than digits to the right of the decimal. • Additional precipitation totals are printed in the column to the right.
Observed Snow Cover Chart • Seasonal chart (Sept - April) • Depicts snow cover at 12Z each day • Snow cover is in whole inches. • Recent accumulations (within the last 6 hours) is depicted by blocked numbers to the right. • Example: 16 9
Upper Air Analysis Charts • Generated every 12 hours with 00Z and 12Z data (charts are available on DIFAX 2 to 5 hours after this time). • Produced from the NAM Model analysis • The NAM Model uses a first guess from the previous model run 6 or 12 hours earlier as a basis for constructing the analysis fields. • Data is incorporated into the first-guess field and the analysis is created via Optimal Interpolation (OI) or 4-D Data Assimilation. • Actual data is plotted on chart, but may not agree with the chart’s analyzed fields.
Upper Air Station Model Decoding Heights 850mb: 150 = 1500m 700mb: 300 = 3000m 500mb: 540 = 5400m 300mb: 900 = 9000m 250mb: 000 = 10,000m Dewpoint Depression T: -5 C DD: 12 C Td = T – DD Td = -17 C DD < 5 C considered near Sat.
850 mb Chart • Isoheights (solid contours) • 30 m intervals with 1500 m (150 decameters) reference line • contour labels in decameters • plotted heights are in meters (generally add 1 in thousands digit) • Isotherms (dashed contours) • 5oC intervals with 0oC reference line
850 mb Chart • Uses: • Low Level Jets • Lower tropospheric temperature advection and thermal profile (thermal ridges and troughs) • Lower tropospheric moisture advection and profiles (moist and dry tongues) • Height changes • Caution: • Sometimes underground near high terrain
Thermal Advection • Advection – Horizontal movement of some atmospheric property (Temp, Moisure, Thickness, Vorticity), usually by the wind or atmospheric flow. • Why is Thermal Advection important? • Helps identify the location and movement of fronts • Helps in identifying regions of slantwise upward & downward vertical air motion (tied to isentropic lifting) • Rapid moisture transport can provide additional instability for thunderstorm development.
700 mb Chart • Isoheights (solid contours) • 30 m intervals with 3000 m (300 decameters) reference line • contour labels in decameters • plotted heights are in meters (generally add 2 or 3 in thousands digit) • Isotherms (dashed contours) • 5oC intervals with 0oC reference line
700 mb Chart • Uses: • Elevated tropospheric moisture advection and profiles (elevated dry intrusions; moist tongues) • Mid-tropospheric temperature advection and thermal profile (thermal ridges and troughs) • Mid-level jets • Height changes • Caution: • Sometimes near surface in higher terrain
500 mb Chart (North America) • Isoheights (solid contours) • 60 m intervals with 5400 m (540 decameters) reference line • contour labels in decameters • plotted heights are in decameters (add 0 in ones digit for meters) • Isotherms (dashed contours) • 5oC intervals with 0oC reference line
500 mb Chart (North America) • Uses: • Wave pattern in the westerlies • Identification of longwaves and shortwaves • Height changes and wave motion • Approximate steering level for surface synoptic systems • Vertical and horizontal tilt of waves • Mid-tropospheric temperature advection and thermal profile (warm and cold pools) • Mid-tropospheric moisture profiles
500 mb Chart (Hemispheric) • Contains the same contours as the 500 mb North American analysis, except void of data plots • Additional Uses: • Circumpolar vortex configuration • Planetary wave number and pattern • Wave identification • Internet Address (Environment Canada): • http://weatheroffice.ec.gc.ca/data/analysis/sai_50.gif
300 mb Analysis • Isoheights (solid contours) • 120 m intervals with 9000 m (900 decameter) reference line • contour labels in decameters • plotted heights are in decameters (add 0 in ones digit for meters) • Isotherms (dashed heavy contours) • 5oC intervals with -50oC reference line
300 mb Analysis • Isotachs (light dashed contours) • 20 knot intervals with a 10 knot reference line • Stippled regions represent: • 70-110 knot winds • 150-190 knot winds