Download
1 / 1
10 likes | 167 Views
MEASUREMENT OF SUBLINGUAL BLOOD VELOCITY Leonard W. Winchester and Nee-Yin Chou CW Optics, Inc., Yorktown, Virginia, USA. Background

E N D
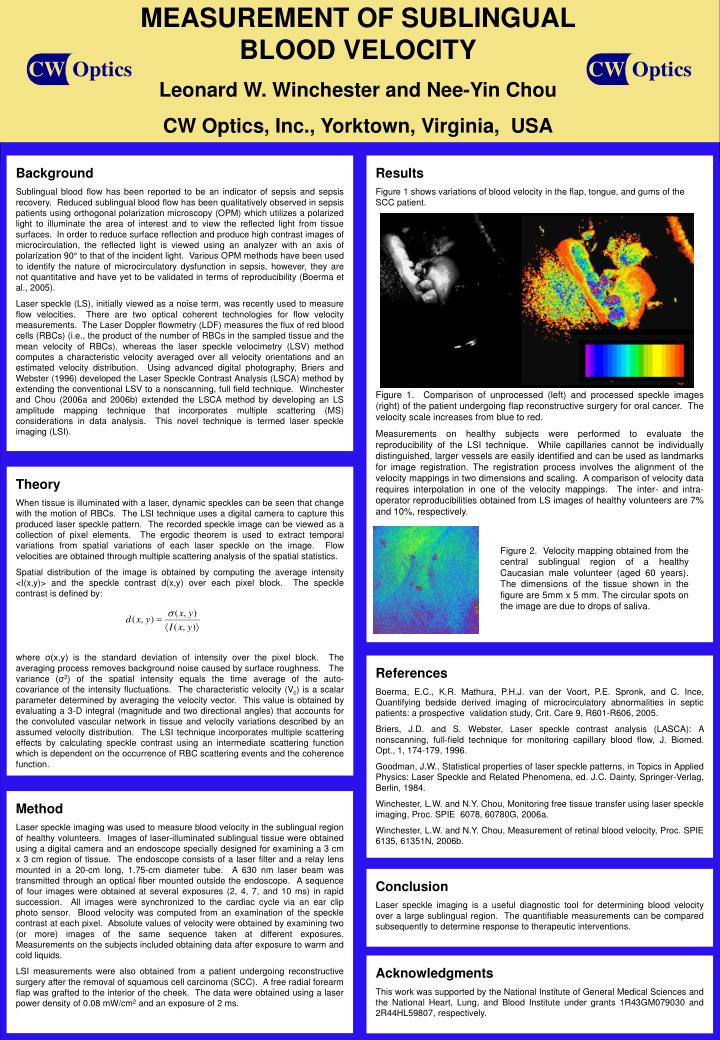
MEASUREMENT OF SUBLINGUAL BLOOD VELOCITY Leonard W. Winchester and Nee-Yin Chou CW Optics, Inc., Yorktown, Virginia, USA Background Sublingual blood flow has been reported to be an indicator of sepsis and sepsis recovery. Reduced sublingual blood flow has been qualitatively observed in sepsis patients using orthogonal polarization microscopy (OPM) which utilizes a polarized light to illuminate the area of interest and to view the reflected light from tissue surfaces. In order to reduce surface reflection and produce high contrast images of microcirculation, the reflected light is viewed using an analyzer with an axis of polarization 90° to that of the incident light. Various OPM methods have been used to identify the nature of microcirculatory dysfunction in sepsis, however, they are not quantitative and have yet to be validated in terms of reproducibility (Boerma et al., 2005). Laser speckle (LS), initially viewed as a noise term, was recently used to measure flow velocities. There are two optical coherent technologies for flow velocity measurements. The Laser Doppler flowmetry (LDF) measures the flux of red blood cells (RBCs) (i.e., the product of the number of RBCs in the sampled tissue and the mean velocity of RBCs), whereas the laser speckle velocimetry (LSV) method computes a characteristic velocity averaged over all velocity orientations and an estimated velocity distribution. Using advanced digital photography, Briers and Webster (1996) developed the Laser Speckle Contrast Analysis (LSCA) method by extending the conventional LSV to a nonscanning, full field technique. Winchester and Chou (2006a and 2006b) extended the LSCA method by developing an LS amplitude mapping technique that incorporates multiple scattering (MS) considerations in data analysis. This novel technique is termed laser speckle imaging (LSI). Results Figure 1 shows variations of blood velocity in the flap, tongue, and gums of the SCC patient. Figure 1. Comparison of unprocessed (left) and processed speckle images (right) of the patient undergoing flap reconstructive surgery for oral cancer. The velocity scale increases from blue to red. Measurements on healthy subjects were performed to evaluate the reproducibility of the LSI technique. While capillaries cannot be individually distinguished, larger vessels are easily identified and can be used as landmarks for image registration. The registration process involves the alignment of the velocity mappings in two dimensions and scaling. A comparison of velocity data requires interpolation in one of the velocity mappings. The inter- and intra-operator reproducibilities obtained from LS images of healthy volunteers are 7% and 10%, respectively. Theory When tissue is illuminated with a laser, dynamic speckles can be seen that change with the motion of RBCs. The LSI technique uses a digital camera to capture this produced laser speckle pattern. The recorded speckle image can be viewed as a collection of pixel elements. The ergodic theorem is used to extract temporal variations from spatial variations of each laser speckle on the image. Flow velocities are obtained through multiple scattering analysis of the spatial statistics. Spatial distribution of the image is obtained by computing the average intensity <I(x,y)> and the speckle contrast d(x,y) over each pixel block. The speckle contrast is defined by: where σ(x,y) is the standard deviation of intensity over the pixel block. The averaging process removes background noise caused by surface roughness. The variance (σ2) of the spatial intensity equals the time average of the auto- covariance of the intensity fluctuations. The characteristic velocity (Vc) is a scalar parameter determined by averaging the velocity vector. This value is obtained by evaluating a 3-D integral (magnitude and two directional angles) that accounts for the convoluted vascular network in tissue and velocity variations described by an assumed velocity distribution. The LSI technique incorporates multiple scattering effects by calculating speckle contrast using an intermediate scattering function which is dependent on the occurrence of RBC scattering events and the coherence function. Figure 2. Velocity mapping obtained from the central sublingual region of a healthy Caucasian male volunteer (aged 60 years). The dimensions of the tissue shown in the figure are 5mm x 5 mm. The circular spots on the image are due to drops of saliva. References Boerma, E.C., K.R. Mathura, P.H.J. van der Voort, P.E. Spronk, and C. Ince, Quantifying bedside derived imaging of microcirculatory abnormalities in septic patients: a prospective validation study, Crit. Care 9, R601-R606, 2005. Briers, J.D. and S. Webster, Laser speckle contrast analysis (LASCA): A nonscanning, full-field technique for monitoring capillary blood flow, J. Biomed. Opt., 1, 174-179, 1996. Goodman, J.W., Statistical properties of laser speckle patterns, in Topics in Applied Physics: Laser Speckle and Related Phenomena, ed. J.C. Dainty, Springer-Verlag, Berlin, 1984. Winchester, L.W. and N.Y. Chou, Monitoring free tissue transfer using laser speckle imaging, Proc. SPIE 6078, 60780G, 2006a. Winchester, L.W. and N.Y. Chou, Measurement of retinal blood velocity, Proc. SPIE 6135, 61351N, 2006b. Method Laser speckle imaging was used to measure blood velocity in the sublingual region of healthy volunteers. Images of laser-illuminated sublingual tissue were obtained using a digital camera and an endoscope specially designed for examining a 3 cm x 3 cm region of tissue. The endoscope consists of a laser filter and a relay lens mounted in a 20-cm long, 1.75-cm diameter tube. A 630 nm laser beam was transmitted through an optical fiber mounted outside the endoscope. A sequence of four images were obtained at several exposures (2, 4, 7, and 10 ms) in rapid succession. All images were synchronized to the cardiac cycle via an ear clip photo sensor. Blood velocity was computed from an examination of the speckle contrast at each pixel. Absolute values of velocity were obtained by examining two (or more) images of the same sequence taken at different exposures. Measurements on the subjects included obtaining data after exposure to warm and cold liquids. LSI measurements were also obtained from a patient undergoing reconstructive surgery after the removal of squamous cell carcinoma (SCC). A free radial forearm flap was grafted to the interior of the cheek. The data were obtained using a laser power density of 0.08 mW/cm2 and an exposure of 2 ms. Conclusion Laser speckle imaging is a useful diagnostic tool for determining blood velocity over a large sublingual region. The quantifiable measurements can be compared subsequently to determine response to therapeutic interventions. Acknowledgments This work was supported by the National Institute of General Medical Sciences and the National Heart, Lung, and Blood Institute under grants 1R43GM079030 and 2R44HL59807, respectively.