Download
1 / 21
210 likes | 342 Views
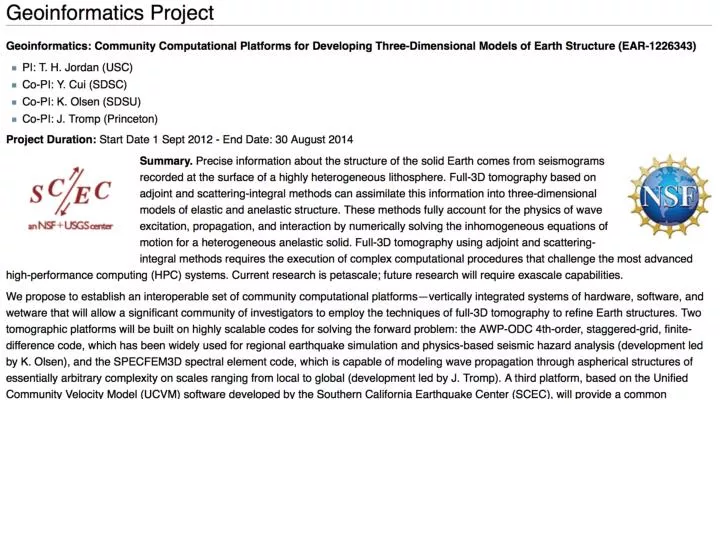
NSF Geoinformatics Project (Sept 2012 – August 2014). Geoinformatics: Community Computational Platforms for Developing Three-Dimensional Models of Earth Structure PI: T. H. Jordan (USC); Co-PIs: Y . Cui (SDSC), K. Olsen (SDSU), and J. Tromp (Princeton )

E N D
NSF Geoinformatics Project(Sept 2012 – August 2014) Geoinformatics: Community Computational Platforms for Developing Three-Dimensional Models of Earth Structure PI: T. H. Jordan (USC); Co-PIs: Y. Cui (SDSC), K. Olsen (SDSU), and J. Tromp (Princeton) Year- 1 plan is a set-up and demonstration phase comprising seven principal tasks: Task 1.1. Assemble community computational platforms from existing software components and deploy them at NWSC. Task 1.2. Optimize computational performance of AWP-ODC and SPECFEM3D codes on NWSC Yellowstone supercomputer. Task 1.3. Adapt Pegasus-WMS to support file management on community computational platforms. Task 1.4. Synthesize existing California CVM components and publish a statewide starting CVM for full- 3D inversion Task 1.5. Cross-validate the AWP-ODC and SPECFEM3D platforms. Task 1.6. Preserve constraints on CVM shallow structure during tomographic inversions. Task 1.7. Demonstrate capabilities for adjoint tomography on a global scale. The Year-2 plan is a production and delivery phase comprising seven principal tasks: Task 2.1. Exploit heterogenouspetascale architectures for GPU-based accelerations of AWP-ODC and SPECFEM3D codes and verify performance by executing standard forward problems Task 2.2. Establish automated scientific workflows for full-3D inversions on the AWP-ODC and SPECFEM3D platforms. Task 2.3. Produce statewide California CVMs by full-3D inversions of earthquake, ambient-noise, and prior-constraint data on the AWP-ODC and SPECFEM3D platforms. Task 2.4. Validate full-3D tomography through UCVM-based comparisons of California inversion results from the AWP-ODC and SPECFEM3D platforms. Task 2.5. Deploy federated data management tools at NWSC and SCEC data centers for managing life- cycle of community data collections. Task 2.6. Complete the first phase of global adjoint tomography. Task 2.7. Publish improved statewide California CVMs for use in CyberShake hazard modeling.
Figure 3: (a) Map of topography and major faults (thick black lines) of southern California. (b) The optimal perturbation results of the southern California tomographic inversion including iteration CVM-S4.21 performed on Yellowstone. In perturbation maps, the red regions represent velocity reduction areas and the blue regions represent velocity increase areas.
CVM4 VS 10km 3.6 km/s ± 15% CVM4SI22 VS 10km 3.6 km/s ± 15% Perturbation 10km VS of CVM4 ± 15% Perturbation 20km VS of CVM4 ± 10% CVM4 VS 20km 3.8 km/s ± 10% CVM4SI22 VS 20km 3.8 km/s ± 10%
NC NC CVM4 CVM4SI22
Model enhancements – 3D adjoint waveform tomography Seismogram-based estimates of the resolvable period • Perform two sets of 150 simulations for the fine and coarse mesh. • Using the two sets of synthetics, thoroughly document the resolvable periods. This will dictate what bandpass will be used for measurements in the inversion. • Move forward with CVM-H inversion, with emphasis on the uppermost 10 km and at a numerical resolution of 2 s. Tape et al., 2013
Probabilistic Seismic Hazard Analysis • What will peak ground motion be over the next 50 years? • Used in building codes, insurance, government, planning • Answered via Probabilistic Seismic Hazard Analysis (PSHA) • Communicated with hazard curves and maps 2% in 50 years 0.6 g Hazard curve for downtown LA Probability of exceeding 0.1g in 50 yrs
CyberShake Study 13.4 • Interested in velocity model, SGT code contribution to PSHA • Planned CyberShake run • 286 locations in Southern California • 4 permutations of velocity model, SGT code • Use Blue Waters, Stampede, HPCC
CyberShake workflows Tensor Workflow Post-Processing Workflow Seismogram synthesis Tensor extraction Seismogram synthesis Hazard Curve Mesh generation Tensor simulation . . . . . . Tensor extraction Seismogram synthesis x1 x1 x2 x7,000 x415,000
Scientific Workflows • Large-scale, heterogeneous, high throughput • Parallel and many (~415,000) serial tasks • Automation • Data management • Error recovery • Resource provisioning • Scalable • We use Pegasus-WMS,HTCondor, Globus
Workflow Tool Development to Support CyberShake • We started with excellent scientific codes and improved it over 5 years. • In the following section, we describe a number of late-stage improvements that enabled us to reach the M8 milestone.
Pegasus-mpi-cluster • Ships with Pegasus-WMS • MPI wrapper around serial or thread-parallel jobs • Master-worker paradigm • Preserves dependencies • Specify jobs as usual, Pegasus does wrapping • Uses intelligent scheduling • Core counts, memory requirements, priorities • Locality preferences under development • Can aggregate output • Master collects worker output, writes in large chunks
Computational Requirements Tensor Creation Post Processing This is for one location of interest; want to run >1000
CyberShake Study 13.4 Performance • April 17, 2013 – June 17, 2013 • Blue Waters (MPI SGT workflows): • Average of 19,300 cores, 8 jobs • Stampede (HTC post-processing workflows): • Average of 1,860 cores, 4 jobs • 470 million tasks executed (177 tasks/sec) • 21,912 jobs total • Managed 830 TB of data • 57 TB output files • 12.3 TB staged back to HPCC (~16M files) • 1.5 billion rows added to database
CyberShake Study 13.4 Results Ratio comparison of SGT codes Ratio comparison of velocity models
Future Directions • Migrate to GPU version of SGT code • Create similar maps for third velocity model • Increase frequency of calculations from 0.5 to 1 Hz • 16x for SGT calculations • 50x for post-processing • Move to newest earthquake rupture forecast, UCERF 3.0 • 25x earthquakes to consider
For More Information Please Visit:http://scec.usc.edu/scecpediaEnd