Download
1 / 28
280 likes | 487 Views
https://sites.google.com/site/keanstartalk2010/home. http:// myildiz.weebly.com /global- kitchen.html. The goals of the study are to: work with in-service teachers, health educators elementary school students;

E N D
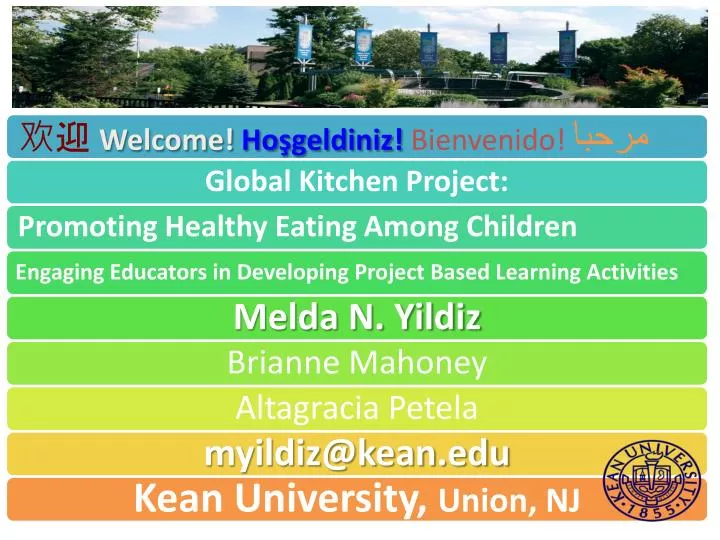
https://sites.google.com/site/keanstartalk2010/home http://myildiz.weebly.com/global-kitchen.html
The goals of the study are to: • work with in-service teachers, health educators elementary school students; • promote health education, global literacy, collaboration fluency and 21st century skills among in-service and preserviceteachers; • research the role of project based “Global Kitchen Project” activities in developing healthy eating habits and 21st century skills among elementary students; • explore the use of new technologies (Ipads) in developing global media literacy skills among in-service teachers; and • collaborate with the in-service teachers’ international collaborations, self and peer assessment rubrics, feedback and reactions and their integration of global media literacies and social media technologies into their classroom projects.
Socioeconomic Status & Nutrition • According to the study conducted in the article, “Which Aspects of Socioeconomic Status are Related to Obesity Among Young Men and Women?” there is a strong connection between the prediction of obesity and the socioeconomic level. The higher the socioeconomic status, the less likely to become obese (Internation Journal of Obesity, 2011). • The study conducted in the article, “Does Diet Cost Mediate the Relation Between Socioeconomic Position and Diet Quality?” shows us that those living in higher socioeconomic levels have an overall better level of nutrition. This can be attributed to the fact that many healthy foods are higher priced (European Journal of Clinical Nutrition, 2011). • The article, “Obesity and Socioeconomic Status in Children and Adolescents: United States” exemplifies the the relationship between socioeconomic status and nutrition. The results of the study show that in non-Hispanic, white children the prevalence of obesity increases as socioeconomic status decreases (U.S. Department of Health and Human Services, 2010).
Health Education • Health education is extremely important. According to the U.S. Department of Health and Human Services, children living in highly educated households are less likely to become obese. Therefore, there is a strong correlation between education level and nutrition level. • In New Jersey the Department of Agriculture has outlined standards that each public school must follow during lunchtime for the 2012-2013 school year. Their objective is, “To provide a nutritious, well-balanced lunch for children in order to promote sound eating habits, to foster good health and academic achievement and to reinforce the nutrition education taught in the classroom. A school lunch will provide 1/3 of the Recommended Dietary Allowances for lunch and be consistent with the Dietary Guidelines for Americans and caloric goals.”
Our Research1. Lower Socioeconomic Area • Data was collected over a 2 week period at two elementary schools in Jersey City, NJ. • Socioeconomic Status (2009): Median Family Income: $60,970 Median Per Capita Income: $33,356 (City Data, 2011)
Contextual Factors: School #1 • Community, district and school factors: PS #24 is located in Jersey City, NJ. The school is set in the urban environment of Jersey City. The average class size for grades K-5 is between 19 ad 24 students, which is slightly above the state average. However, the computer to student ratio is 3, which is very close to the state average. With that being said, there are a total of 294 computers in the school, all of which are connected to the internet. Technology is a very integral part of their learning process and PS #24 is definitely adequately equipped according to state standards. • Student characteristics: 9.8% of students in PS #24 are classified as limited English proficient (LEP). • The student mobility rate was high in the 2010-11 school year at 24.3%, with the state average being just 10%. This in addition to the language diversity can create many obstacles for educators. • Language Diversity:
Contextual Factors: School #2 • Contextual Factors: PS #34 • Community, district and school factors: PS #34 is located in Jersey City, NJ. The school is set in the urban environment of Jersey City. The average class size for grades K-5 is between 15 and 21, which is right on target with the state's averages. The student to computer ratio is 14.8 which is very poor in comparison to the state standard of 3.6. With that being said, there are only 39 computers in the whole school and all 39 are connected to the internet. • Student characteristics: 0.2% of students are classified as limited English proficient (LEP). • The student mobility rate was 33.3% in the 2010-11 school year. This is significantly higher than the state's average of 10%. This can create a disrupted classroom environment that makes it more difficult for educators. • Language Diversity
Post Assessment: Teacher Responses 1. How would you rate your students overall knowledge of nutrition before this project? Very Little 100% (4) Somewhat Very Knowledgeable Average 2. Which part of the project did you find to be the most informative? "The most informative part was when they were finding out about the nutritional value of food and using the ipads in a fun, but educational manner." "The most informative part was using technology to enhance their knowledge of nutrition." "All of it was very informative." "The children found the whole project informative and fun, with much credit to the use of ipads." 3. How would you rate your students overall knowledge of nutrition after this project? Very Little Somewhat Very Knowledgeable 100% (4)
Post Assessment Continued 4. Have you noticed a difference in your student's lunch choices since this project? Yes 50% (2) No 50% (2) 5. What changes could be made in the neighborhood to enhance the overall nutrition of your students? "The change in the neighborhood should be the grocery stores not selling candy and junk food to the kids early in the morning." "I do not think it is a neighborhood change, but a change in the parents" "The parents must be just as knowledgeable as the children in order for a change to be made." "The neighborhood will never change, but the food within their home can be changed."
Our Research2. Higher Socioeconomic Area • Data collection was taken during lunchtime at a private kindergarten in Scotch Plains-Fanwood, NJ. • Socioeconomic Status (2009): Median Family Income: $116,393 Median Per Capita Income: $50,665 (City Data, 2011)
Contextual Factors: Private Kindergarten • Classroom Factors: The class is made up of 17 students. There are two computers each connected to the internet. There is a kitchen in school where hot lunches brought from home are heated up. Or students have the option to choose a lunch from “Simply Gourmet.”
Lunchtime Data Collection8/8/08 11:30 pm Student 1: Organic Chicken Patties, Banana, 100 Calorie Pack (Chips Ahoy), Capri Sun Student 2: Turkey Sandwich on Whole Wheat, Bread, Pretzels, Fruit Juice (Minute Maid) Student 3: Mac & Cheese (Kraft), Cheese Stick, 100 Calorie Fruit Snack, Capri Sun Student 4:"Simply Gourmet" Lunch: Salad, Chicken Sandwich, Organic Chocolate Milk (Horizon) Student 5: Eggplant with Brown Rice, Fruit Juice (Minute Maid) Student 6: Chicken Nuggets, Plain Pasta, Mandarin Oranges, Water Student 7: Pasta with Veggies and Marinara Sauce, Plum, Water Student 8: Chicken Nuggets, Ravioli, Water Student 9: Turkey & Cheese, Apple Sauce (Motts), Fruit Falls (Minute Maid), Angry Bird (Fruit Snacks) Student 10: Veggies, Wheat Bread, Water Student 11: Pasta with Sausage, Grapes, Organic Valley Milk Student 12: “Simply Gourmet Lunch:” Wheat Bagel with Cream Cheese, Salad, 100 calorie Gold Fish, Gluten-free Brownie Student 13: Grilled Cheese, Grapes, Apple & Eve Drink, Pudding (Snack Pack) Student 14: “Simply Gourmet Lunch:” Pasta with Marinara Sauce, Salad, Gluten-Free Brownie, Horizon Chocolate Milk
Post Assessment: Teacher Interview • Teacher 1: "Most children eat healthy" "Some parents provide multiple desserts for their child to choose from, which can be overwhelming for them at times." • Teacher 2: "They are pretty good eaters." "Some parents provide too many options." "We eat our packed lunch with the students and it really does have an influence on the students eating habits. One student saw (Teacher 1) with green beans for lunch and they came in that following Monday with green beans so they could be just like (Teacher 1). We find it very important to try to set a good example for the students."
Socioeconomic Level & Nutrition Conclusion • Our findings also show us that there is a strong correlation between Socioeconomic Status and Nutrition. Those students in the private kindergarten had many options to choose from and many of the options were all healthy alternatives. This can most definitely be attributed to the price of healthier foods such as fresh produce, gluten-free, whole wheat and organic products.
Resources Aggarwal, A., Monsivais, P., & Drewnowski, A. (2011). Does diet cost mediate the relation between socioeconomic position and diet quality? European Journal of Clinical Nutrition. City-data. (2011). Retrieved from http://www.city-data.com Kylie, B., Mishra, G., & Crawford, D. (2011). Which aspects of socioeconomic status are related to obesity among men and women? International Journal of Obesity, 26(4), 559-565. Ogden, C. L., Lamb, M. M., & Carroll, M. D. (2010). Obesity and socioeconomic status in children and adolescents: United states. U.S. Department of Health and Human Services. NJDA. (2012). National school lunch program. Retrieved from http://www.nj.gov/agriculture/divisions/fn/childadult/school_lunch.html
Apps used: • BrainPop • ShowMe • BMI • ShopWell • IFaceFat • Restaurants • MyFood • Nutrition • Find My Food • LiveStrongMyplate • Double Eat • WholeFoods
For games and more materials- http://myildiz.weebly.com/global-kitchen.html
Menzel, P., & D'Aluisio, F. (2005). Hungry planet: What the world eats. Napa, Calif: Material World Press. • PhotoEssay- http://www.time.com/time/photogallery/0,29307,1626519,00.html • NPR- http://www.npr.org/templates/story/story.php?storyId=5005952 • http://www.menzelphoto.com/galleries/ • http://www.menzelphoto.com/books/hp.php