Download
1 / 43
430 likes | 551 Views
The Alaska Marine Information System. Searching, showing & serving data. We collect and serve:. Air Temperature Bathymetry Biology CTD Cruise Chlorophyll Climate Data Clouds Dew Point Freezing Level Mass Balance Moorings Nutrients (Cruise data) Ocean Temperature Precipitation

E N D
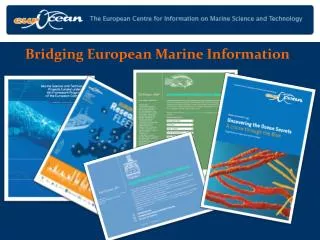
The Alaska MarineInformation System Searching, showing & serving data
We collect and serve: • Air Temperature • Bathymetry • Biology • CTD Cruise • Chlorophyll • Climate Data • Clouds • Dew Point • Freezing Level • Mass Balance • Moorings • Nutrients (Cruise data) • Ocean Temperature • Precipitation • Pressure • Radar • Relative Humidity • Salinity • Sea Ice/Spray Icing • Sea Surface Temperature • Snow Depth • Specific Humidity • Surface Currents • Synthetic Aperture Radar • Tides / Water Level • Water Temperature • Wave Height • Wave Period • Wind Gusts
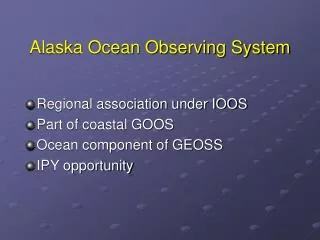
Types of data • Observational (in-situ) • Satellite (remote sensing) • Model (reanalysis; hindcast or forecast)
Multiple access methods: • Portals – data in native format • Web Services: DAP, SOS, WMS, and WCS – IOOS data services • Alaska Marine Information System • Data format transformation service
AMIS 3.0 BETA Searching, showing & serving data: test our new Interface at http://137.229.40.161/amis
Audience What questions are we asking… about existing projects? about proposal and project planning? about data density and availability? Who is asking them? Managers, Scientists, Stakeholders
Ask questions • What projects have taken place in the Arctic? • Search: “Arctic”, “1972-2010” • AMIS returns • project lists with abstract, summary, dates, contact info… • relevant graphics • access to data sets
SEARCH Choose from • Agency • People • Program • Region • Date/Time • Variable • Keyword
SEARCH You can NARROW your search by adding a Variable to any other option (AND). Add to your search • Choose Region • Choose Arctic • Choose Variable • Choose Ice Distribution • Submit Search
Results • There are THREE tabs in the results area • Login (and ordering information) • Project Information • Data Preview and Download
Project Information tab Shows information about projects that match your search
Views • Time Extents (data timeline) • Data Density plots • Station & Collection points
Where was it collected? Cruise lines and station plots
CTD Cruise Bathymetry Biology
Focus on specific date range • Refine a search: change the timeline in the Data Preview and Download tab 2004
See matching files reduced • Use global timeline (grey box) to reduce results • In my example I’ll choose 2004 • Check data densitybefore ordering… start reduce
How much data is there? Choosing Preview Data within a dataset shows you the data density for that collection.
Permissions • Specific datasets may onlybe seen by userswith permission Green results = you may interact with this data
Order • Log in to order • Return to results • Choose download format • Click to order
Download Formats • Choose from CSV, GML, HDF, KML, KMZ, NetCDF, Shape, TIF, depending on SOURCE File • ESRI: Geotiffs, Shapefiles • Excel/OpenOffice: CSV • MATLAB, Ferrett, IDV: NetCDF • Google Maps/Earth/Ocean: KML/KMZ • OpenLayers, uDig: GML • IDL, IDV, SeaDAS: HDF
Manage your orders • Click the myAOOS Login and Info tab to see your orders • Click REFRESH to see your new order • Check the status of orders • Follow links to zipped files/directories
Notification • Once you’ve placed an order you can see the status in your myAOOS tab • Follow the link in your email OR myAOOS tab
Strength • Download the data and • Use it in applications you are familiar with • Data views by 3rd party application or data protocol
WRF Model, AOOS Bathy & Surface station locations as seen in ESRI ArcMap (WMS)
Chlorophyll-a We have tools in place to display layers of data. We will bring these other tools into the AMIS interface. Sea Surface Temperature Sea Ice Concentration
Thank you • Time permitting DO A LIVE SEARCH • Region: Arctic • Show Projects • Show Datasets • Show Time Extents • Move in map to just Arctic • Display IMS CTD data, and Collection Points • Show Submitting Order/select CSV