Download

1 / 14
140 likes | 347 Views
Quality management: New Tools. Presented by: Dr. Husam Arman. New Quality Tools. Affinity Diagrams Interrelationship Diagrams Tree Diagrams. Affinity Diagrams. Organizes a large amount of verbal data related to a broad problem or subject Ideas, opinions, facts

E N D
Quality management: New Tools Presented by: Dr. Husam Arman
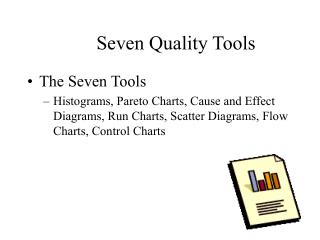
New Quality Tools • Affinity Diagrams • Interrelationship Diagrams • Tree Diagrams
Affinity Diagrams • Organizes a large amount of verbal data related to a broad problem or subject • Ideas, opinions, facts • Usage example: Establishing a new QC policy • Steps: • Gather a large number of ideas • Put individual ideas on cards or sticky notes • As a team, group the ideas according to natural “affinity” or relationship to each other • These natural groups become “strategic factors”
Affinity Diagram Exercise Your team has been brainstorming to develop a list of ideas to incorporate into the vision. They have come up with the following list. Develop an affinity diagram and name each strategic factor. • Low product maintenance • Satisfied employees • Courteous order entry • Low prices • Quick delivery • Growth in shareholder value • Teamwork • Responsive technical support • Personal employee growth • Low production costs • Innovative product features • High return on investment • Constant technology innovation • High quality • Motivated employees • Unique products • Small, lightweight designs
Affinity Diagram Exercise • Low product maintenance • Satisfied employees • Courteous order entry • Low prices • Quick delivery • Growth in shareholder value • Teamwork • Responsive technical support • Personal employee growth • Low production costs • Innovative product features • High return on investment • Constant technology innovation • High quality • Motivated employees • Unique products • Small, lightweight designs
Interrelationship Diagrams • Identifies and explores causal relationships among related concepts or ideas. Can address problems with a complex network of causes and effects. • Identifies key drivers and bottlenecks • Usage examples: design steps to counter market complaints, or reform administrative departments • Steps: • Write each concept or idea on a piece of paper in a circular pattern (allow room between concepts) • Number them to make comparison process easier to track • Use pairwise comparisons (1-2, 1-3, 1-4…2-3, 2,4…3,4) • If there is a relationship draw arrow to effect • If there is no relationship leave blank • No 2-way relationships
Interrelationship Diagrams Cont. • Steps (Cont.) • Analyze the diagram • Count the arrows (# out - # in) • Highest out are primary drivers • Resources here can produce pronounced change • Lowest are key bottlenecks • Affected by many other options • Highlight primary drivers and key bottlenecks • Note: examine only cause and effect relationships.
Interrelationship Diagram Example • Use the strategic factors derived from your affinity diagram to develop an interrelationship diagram. You may use the following: • Customer Value • Work Environment • Customer Service • ROI • Technology • Product Innovation
Tree Diagrams • Expands a purpose into the tasks required to accomplish it. • Usage examples: deploy a quality plan, or develop objectives, policies and implementation steps.
Tree Diagrams (cont.) • Steps: • Work from left to right • Start with the purpose to be accomplished • Generate the high level targets or goals that must be completed to accomplish the purpose • Link each goal to the purpose (these are the first branches of the tree) • Expand on each target to identify and define subordinate tasks to accomplish each target • Link each to their target • Continue expansion process until final level is implementable. • Review logic of completed tree (perhaps with larger group)
Tree Diagram Example • Refer to the key strategic factors (primary driver or key bottleneck) identified from your interrelationship diagram – this will be your purpose. Refer to ideas associated with that factor on your affinity diagram – these will be your primary target or goals. Develop a tree diagram including this information, and expand it into several next level strategies to meet these targets. • If you are unable to gather the required information, use “Customer Service” as your purpose, and “improving the order entry process”, “reducing delivery time” and “improving technical support” as your primary goals.
Key Strategic Factor Goals Strategies Tree Diagram Example Cont.