Download
1 / 34
340 likes | 473 Views
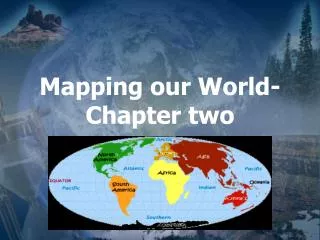
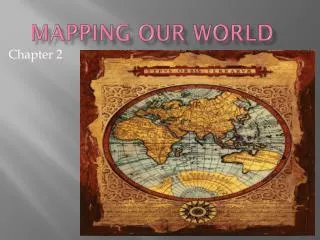
Chapter 2 Mapping our World. 2-7-14. Cartography. The science of mapmaking uses imaginary grids of parallel and vertical lines to locate points on the Earth. Equator. Circles the Earth halfway between the north and south poles Separates the Earth into Northern and Southern Hemisphere

E N D
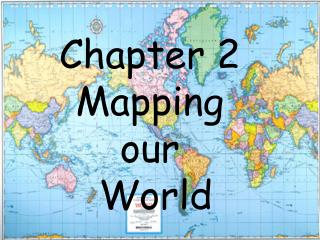
Chapter 2 Mapping our World 2-7-14
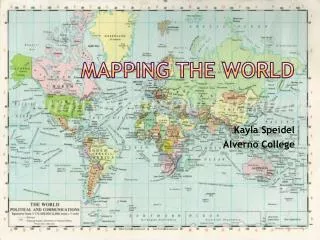
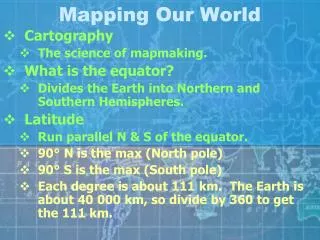
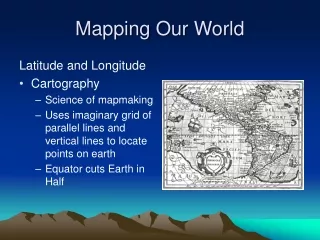
Cartography • The science of mapmaking • uses imaginary grids of parallel and vertical lines to locate points on the Earth
Equator • Circles the Earth halfway between the north and south poles • Separates the Earth into Northern and Southern Hemisphere • 0 degrees (°) latitude
Latitude • Lines running parallel to the equator • Distance in degrees north or south of equator • Poles are 90° latitude • Thus, latitude, is 0° at the equator to 90° at the poles
Longitude • Positions east and west (directions on a map) also referred to as meridian • Distance in degrees east or west of the prime meridian (reference point)
Prime Meridian -Represents 0° longitude -located in Greenwich, England -0° to 180° -West (W) and East (E)
Longitude • Lines aren’t parallel but semicircles that extend vertically from the poles
Locating places • Both values of latitude and longitude are needed • Ex. 30° N, 90° W 30 degrees North of the equator, 90 degrees West of the Prime Meridian.
Time Zones • Divided into 24 zones because it takes Earth 24 hours to rotate once on its axis Each time zone is 15° wide
Time zones • United States has 6 times zones • Eastern, Central, Mountain, Pacific, Alaska Standard, Hawaii-Aleutian
International Date Line • 180 degrees meridian, serves as the transition line for calendar days • Traveling west, advance 1 day. East, move calendar back 1 day
2.2 Types of Maps 2-10-14
Mercator Projection • A map that has parallel lines of latitude and longitude. • Shapes of the landmasses are correct, but their areas are distorted
Conic Projections • Projecting points and lines from a globe onto a cone • The cone touches the globe at a particular latitude (good for small areas)
Gnomonic Projections • Made by projecting points and lines from a globe onto a piece of paper that touches the globe at a single point
Topographic Maps • Detailed map showing hills and valleys of an area • Shows changes in elevation – mountains, rivers, forest, and bridges
Topographic Maps • Contour Lines – connects points of equal elevation (distance above and below sea level) • They never cross
Topographic Maps • Contour interval – the difference in elevation between two side-by-side contour lines • Index contours – numbers representing the elevation of contour lines • Depression Contour Lines – elevation that is lower then the surrounding landscape (hachures)
Map Legends • Explains what the symbols on a map represent
Map Scales • Ratio between distances on a map and actual distances on the surface of Earth • Verbal • Graphic • Fractional
Map Scales • Verbal Scale – expresses distance as a statement • “1 centimeter is equal to 1 kilometer” • Which means one centimeter on the map represents one kilometer on Earth’s surface
Graphic Scales – consists of a line that represents a certain distance, such as 5km or 5 miles • Line is broken down into sections w/each section representing a distance on Earth’s surface
Map Scales • Fractional scale – distance as a ratio, such as 1:63 500 • One unit on the map represents 63,500 units on Earth’s surface • Can be centimeters (cm) or feet or meters (m), etc.
2.3 Remote Sensing The Process of collecting data about Earth from far above Earth’s surface
Electromagnetic Spectrum • Arrangement of electromagnetic radiation according to wavelength • Visible light, gamma rays, x-rays, microwaves, etc….
Electromagnetic Spectrum • Waves can be described in frequency – number of waves that pass a particular point each second
Landsat Satellites • Receives reflected wavelengths of energy emitted by Earth’s surface (includes wavelengths of visible light and infrared radiation)
Landsat Satellites • Shows features on Earth’s surface and how they can radiate heat – thus they show up in different colors • Examples – rivers, forests
Topex/Poseidon Satellite • Use radar to map features on the ocean floor • Topex – “topography experiment” • Device that picks up the returning echo as it is reflected off the water
Topex/Poseidon • Variations in time indicate the presence of certain features on the ocean floor • Example – ocean water bulges over seafloor mountains and forms depressions over seafloor valleys
Global Positioning System • Radio-navigation system of at least 24 satellites that allows its users to determine their exact location
Sea Beam • Similar to the Topex/Poseidon but uses sonar (sound waves to detect and measure objects underwater) & is located on a ship
Sea Beam • Computers are able to calculate the distance to the ocean bottom using the speed of sound in water (1500 m/s) and the time it takes for the sound to be reflected