Download
1 / 25
250 likes | 361 Views
Applying the SWIM2 Integrated Model For Freight Planning in Oregon. Prepared for the 13 th TRB Transportation Planning Applications Conference May 9, 2011. Presented by Becky Knudson Oregon DOT Transportation Planning Analysis Unit. Presentation Highlights. Describe Freight Plan analysis

E N D
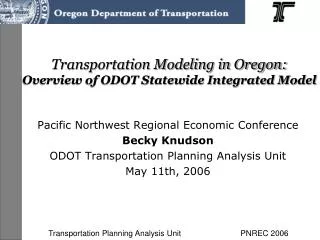
Applying the SWIM2 Integrated Model For Freight Planning in Oregon Prepared for the 13th TRB Transportation Planning Applications Conference May 9, 2011 Presented by Becky Knudson Oregon DOT Transportation Planning Analysis Unit
Presentation Highlights Describe Freight Plan analysis Brief overview of the Statewide Integrated Model (SWIM2) Key factors of effective modeling for long range planning Contribution of analysis to planning process
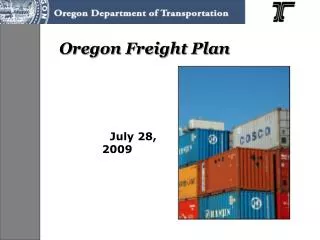
Oregon Freight Plan First statewide freight plan Scope of analysis was well matched to SWIM2 model ODOT modeling staff served role as internal consultants Consultant staff served as extension of ODOT staff Support of Freight Plan analysis Continue model development
Freight Plan Analysis Purpose Forecast range of likely economic conditions to gain understanding of effects on freight movement Illustrate variation in statewide and regional activity and commodity flows Provide information to support development of freight strategies
Analytical Approach Plan for freight flows given an uncertain economic future Use scenarios to evaluate range of possible futures Reference: “business-as-usual” (2.0%*) Optimistic: more economic growth (2.7%*) Pessimistic: less economic growth (1.2%*) High Transportation Costs: Pessimistic scenario with 3-fold increase in variable operating costs * Compound Annual Growth Rates
Oregon StateWide Integrated Model (SWIM2) as Forecast Tool SWIM is dynamic integrates the dynamic interactions of land use, the economy and transportation infrastructure SWIM1 used successfully on several statewide analyses Proved its value repeatedly Generated support for SWIM2 development SWIM2 has greater spatial acuity more detailed inputs and components Can evaluate more policy options
StateWide Integrated Model (SWIM2) Activity Logsums ECONOMY Employment by Industry Construction$ Totals SPATIAL Production Totals Space Prices Occupied Space Demand LAND DEVELOPMENT SYNTHETIC POPULATION Space Inventory ALLOCATION HH Labor Mode Choice Logsums Travel Time/Costs Labor Flows$ Commodity Flows$ (internal, import, export) Person Goods External TRANSPORT Travel Time/Costs OD Trip Tables Aggregate/Equilibrium Micro-simulation Next Time Period Feedback ASSIGNMENT
StateWide Integrated Model (SWIM2) Activity Logsums ECONOMY Employment by Industry Construction$ Totals SPATIAL Production Totals Space Prices Occupied Space Demand Economic Components Spatially Represented LAND DEVELOPMENT SYNTHETIC POPULATION Space Inventory ALLOCATION HH Labor Mode Choice Logsums Travel Time/Costs Population – Production/Consumption – Land Use Labor Flows$ Commodity Flows$ (internal, import, export) Person Goods External TRANSPORT Travel Time/Costs OD Trip Tables Aggregate/Equilibrium Micro-simulation Next Time Period Feedback ASSIGNMENT
StateWide Integrated Model (SWIM2) Activity Logsums ECONOMY Employment by Industry Construction$ Totals SPATIAL Production Totals Space Prices Occupied Space Demand Economic Components Spatially Represented LAND DEVELOPMENT SYNTHETIC POPULATION Space Inventory ALLOCATION HH Labor Mode Choice Logsums Travel Time/Costs Population – Production/Consumption – Land Use Labor Flows$ Commodity Flows$ (internal, import, export) Person Goods External TRANSPORT Transportation Components Travel Time/Costs OD Trip Tables Aggregate/Equilibrium Micro-simulation Next Time Period Feedback Workers – Commodities and Services (imports/exports, internal) ASSIGNMENT Traffic Assignment
Effective Modeling for Long Range Planning • Myth:Sophistication of the modeling tool is the number one component of effective modeling Watson on Jeopardy
Key Factors of Effective Modeling Analysis Use models to inform and manage risk The true value of modeling comes from how the analyst uses the tool, not the tool itself Direct access to analyst Answer questions immediately, alleviate misconceptions Gain understanding of goals and objectives Analyst must have good communication skills Use good visuals - no jargon get-to-the-point - relate findings to project goals
Group 7 Production and Consumption of Commodities by Non-Household Activities Group 8 Imports and Exports of Commodities ALD Space Development Group 2 Production of Labor by Households Group 3 Use of Space by Non-Household Activities Group 9 Financial Flows Group 6 Consumption of Commodities and Labor by Households Group 4 Use of Labor by Non-Household Activities Group 5 Use of Space by Households Transport Demand and Supply
Stronger economy generates more commodity flow in terms of value Stronger economy generates more commodity flow in terms of tons Even Better Use this…
SWIM VIZTool 1) Query 2) Tables 3) Visuals
Contribution of Modeling Analysis to the Planning Process • Source of descriptive data used to frame discussion • Described economic conditions • Illustrated regional differences • revealed patterns of activity • Use model scenarios to address risk • facilitates planning despite many unknowns • Helped identify core issues • Reduced perception of bias
Conclusions • Models are powerful tools • Effectiveness is determined by how they are used • Good sources of descriptive data • Good for evaluating “what if” scenarios, assessing risk • Using them for long range planning takes time and forethought • Planners and modelers must work together to realize the full potential of using these tools • The extra time used for analysis pays off in the end with a more productive outcome and smoother process Having our own Watson would be really, really cool
For more information… Becky Knudson Oregon DOT, Planning Analysis Unit rebecca.a.knudson@odot.state.or.us Alex Bettinardi Oregon DOT, Planning Analysis Alexander.o.bettinardi@odot.state.or.us Oregon Freight Plan:http://www.oregon.gov/ODOT/TD/FREIGHT/FREIGHT_PLAN.shtml Doug Hunt University of Calgary jdhunt@ucalgary.ca Tara Weidner Parsons Brinckerhoff weidner@pbworld.com Erin Wardell Parsons Brinckerhoff wardell@pbworld.com