1 / 16

Graphing in Science

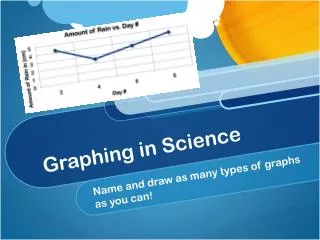
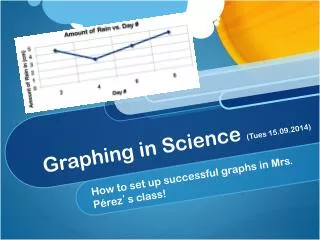
Learn how to create appropriate graphs and communicate data effectively in science using tables and graphs.

mumaw
Download Presentation

Graphing in Science

An Image/Link below is provided (as is) to download presentation Download Policy: Content on the Website is provided to you AS IS for your information and personal use and may not be sold / licensed / shared on other websites without getting consent from its author. Content is provided to you AS IS for your information and personal use only. Download presentation by click this link. While downloading, if for some reason you are not able to download a presentation, the publisher may have deleted the file from their server. During download, if you can't get a presentation, the file might be deleted by the publisher.

E N D

Presentation Transcript


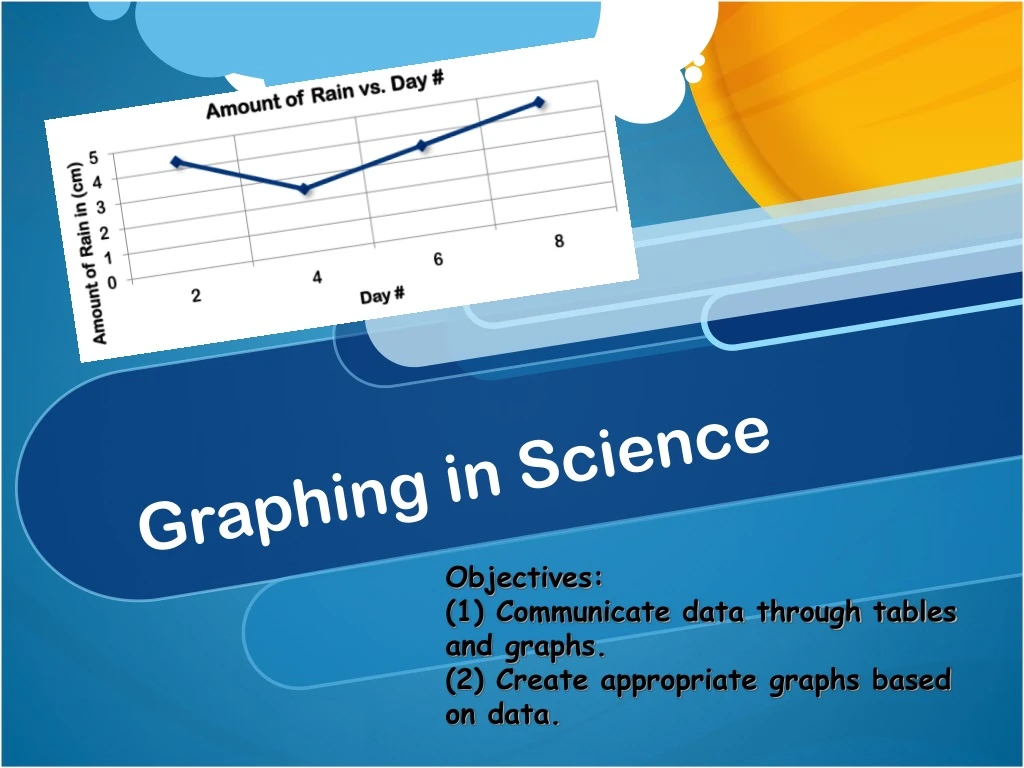
  1. Graphing in Science Objectives: (1) Communicate data through tables and graphs. (2) Create appropriate graphs based on data.

  2. What are the parts of a graph?

  3. What are the parts of a graph? Title = DV vs. IV Y-axis = DV X-axis = IV

  4. Graphing in Science 09.09.2008

  5. Example

  6. What is the IV?

  7. What is the DV?

  8. What would the title of the graph be?

  9. Example

  10. Quick Practice Create a line graph for the given data.

  11. Quick Practice:completed

  12. Graph Types Vs.

  13. Graph Types Line Graph - Use when the IV changes amount (day #, amount of fertilizer, # of trials, etc.)

  14. Graph Types Bar Graph - Use when the IV changes type (person name, color of flower, etc.)

  15. Graphing in Science

  16. Graph ✔ list • Data in correct location ( IV on x-axis; DV on y-axis. • Axes labeled with units (cm, L, s, kg, etc.) • Axes evenly spaced out • Accurate title • Correct graph type

More Related